trest
Performance
College Endowments Report Fiscal 2019 Returns, and the News Isn’t Good
Autumn is back to school season, and while some people might think about tailgating at football games, there is another competition that takes place on campuses every fall, colleges report their investment returns. While FoundationAdvocate's ("FA") focus is the private foundation universe, we are keenly interested in their nonprofit cousins, college endowments. Unlike most … [Read more...] about College Endowments Report Fiscal 2019 Returns, and the News Isn’t Good
Risk & Return = Volatility and Performance
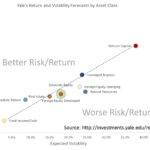
Risk & Return: Yale's Long Term Expectations By Asset Class Yale's endowment report is an incredible resource for investors. One reason it should be required reading for trustees is the excellent discussion on asset classes. In the report, Yale discloses it's long term real-return expectations by asset class. The purpose of including it in this article is to showcase … [Read more...] about Risk & Return = Volatility and Performance
How Are Foundation’s Doing? May 2019 Topic: International a Drag

Every month, Foundation Advocate chooses one topic relating to foundation investment performance to highlight. This month we took a look at how international stock allocations have likely held back foundation performance. Why Haven't Foundations Done Better in this 10 Year Bull Market? Following the financial crisis, the US stock market has been on a pretty great … [Read more...] about How Are Foundation’s Doing? May 2019 Topic: International a Drag
How are Foundations Doing? April 2019 Topic: Who Should We Compare Ourselves To?

Every month, Foundation Advocate chooses one aspect of foundation investment performance to highlight. This month we ask a very fundamental question, Who Should We Compare Ourselves To? Before answering this seemingly straightforward question about performance, it might be useful to establish a quick framework to place performance into context. Rather than lead with … [Read more...] about How are Foundations Doing? April 2019 Topic: Who Should We Compare Ourselves To?
1% Better Investment Performance – Implication for Charitable Giving

The Math is SimplePrivate foundations have $1 trillion in assets. An incremental 1% return on investment would yield an additional $10 billion....per year...every year.To put that in perspective, the additional $10 billion would equal the annual charitable support provided by 12 Ford Foundations, 36 Rockefellers, or 45 Carnegies - you get the picture. Better returns of just 1% … [Read more...] about 1% Better Investment Performance – Implication for Charitable Giving