Risk & Return: Yale’s Long Term Expectations By Asset Class
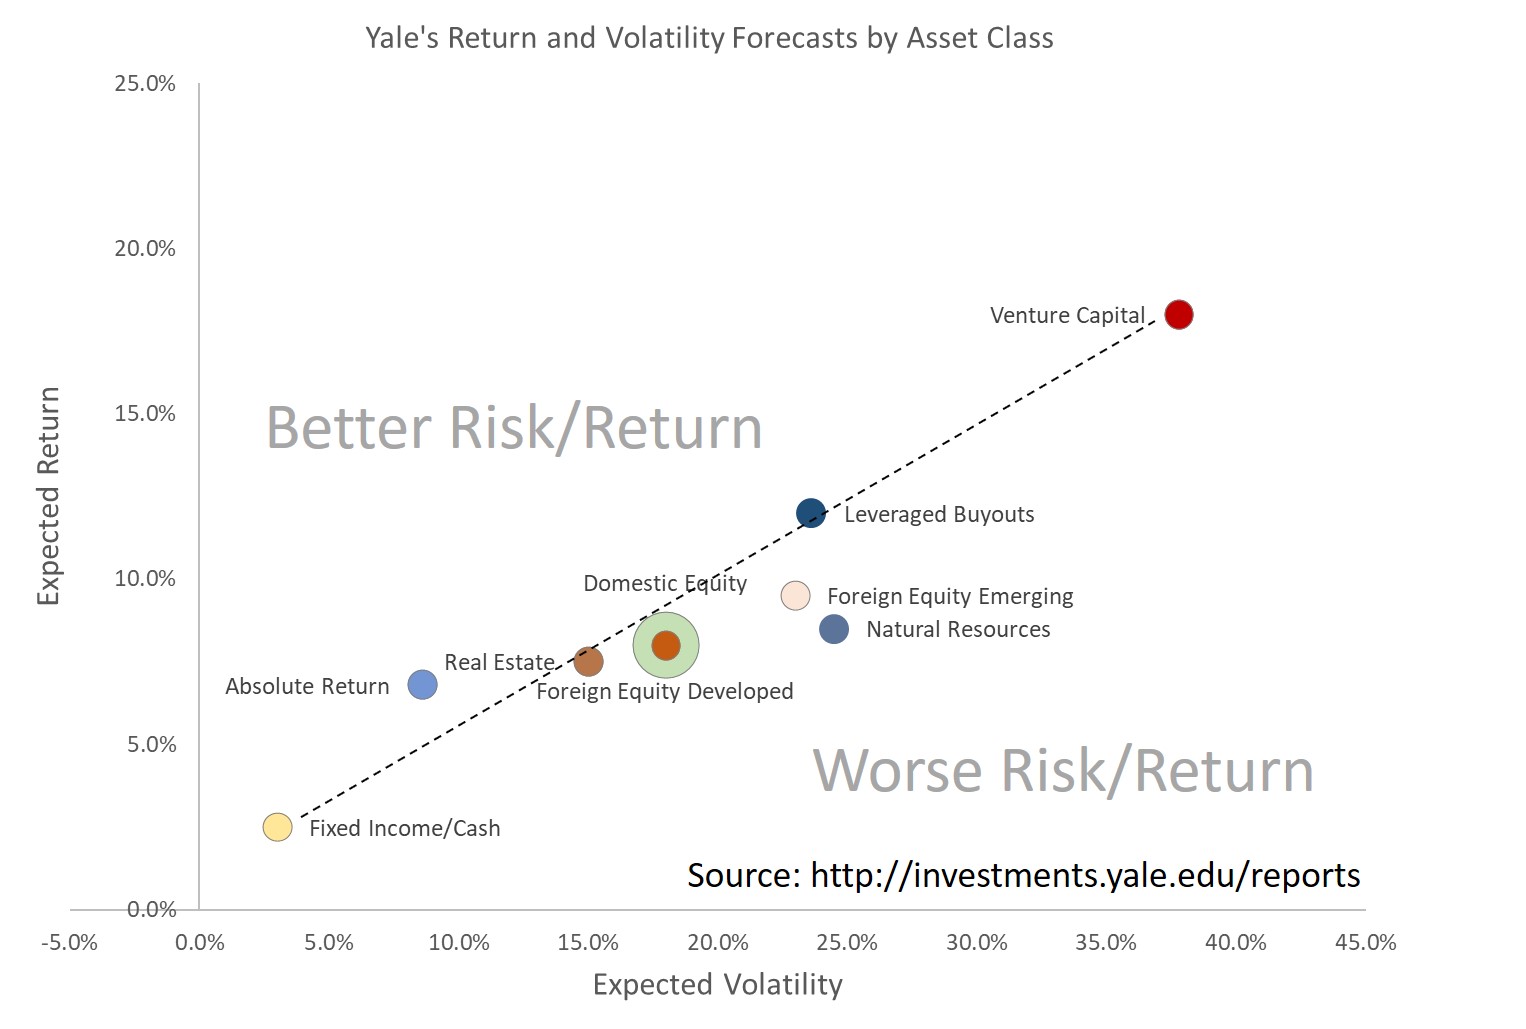
Yale’s endowment report is an incredible resource for investors. One reason it should be required reading for trustees is the excellent discussion on asset classes. In the report, Yale discloses it’s long term real-return expectations by asset class. The purpose of including it in this article is to showcase the relationship between risk and return, not any endorsement of the numbers or return expectations.
This article intends to summarize some core financial theory, but in no way is a substitute for independent research on complex topics.
Risk Adjusted Returns
Measuring Financial Performance
It is very easy to measure return – the profit or loss (realized or unrealized) earned on an investment – but often that doesn’t tell the whole story. As seen in the chart above, Yale’s research projects a more or less linear relationship between return and risk/volatility* (see below) across asset classes. There is a measurement called the Sharpe ratio that quantifies amount of return earned per measure of volatility. The Sharpe ratio is approximated above by the dotted line and essentially shows that all asset classes have a similar risk/return profile – ones below the line, slightly worse, ones above slightly better. In laymen’s terms this means, there is no such thing as a free lunch – if you want high returns you need to accept higher volatility and the converse, if you want low volatility, you better be OK with low returns.
In some ways, it is not unlike horse racing, you need the incentive of a better payoff on a long shot to compensate for the likelihood that a 30 to 1 won’t be crossing the finish line ahead of the favorites. While the long shot bet appears “riskier” because the horse probably won’t win, in fact the bet carries the same risk/reward profile as a bet on the favorite, which has a better chance of winning, but a much lower payout.
Many investors are accustomed to the phrase “risk adjusted returns” but typically returns aren’t presented in that manner – simply the return itself without an explanation of the mitigating “risk adjustment”. Investors should ask, Are we getting compensated for the risks we are taking? Foundation trustees may want to talk to their advisors about goals and risk tolerance levels.
*Volatility Introduction
The basic idea of volatility as risk has to do with the potential for different outcomes. Volatility is best described by example, think of money in a savings account – it sits there earning a low interest rate, but it’s value doesn’t bounce around at all. Now think of a biotech stock – it’s value can gyrate wildly on speculation whether its new drug will be approved or not. Between cash and biotech are all kinds of investments – utility stocks, high yield bonds, tech stocks and many more investment vehicles – whose values rise and fall every day based on what investors see coming down the road. Some prices don’t change that much while others have much larger reactions to news and market moves. These price fluctuations are measured, calculated and called volatility. One important thing about volatility is it that it provides a quantitative measurement, so rather than just saying something was “riskier” than something else, the two can be compared by their volatility measurement as seen in the chart. (It bears noting that non public investments such as venture capital and private equity typically use volatility estimates based on public markets as their values are not calculated frequently or in the public domain).
Yale's Expected Return and Volatility
| Asset class | Expected Return* | Expected Volatility | Target Weight | Public Benchmark |
|---|---|---|---|---|
| Absolute Return | 6.8% | 8.6% | 26.0% | Barclays 9 to 12 Month Treasury Index |
| Domestic Equity | 8.0% | 18.0% | 3.0% | Wilshire 5000 Index |
| Fixed Income/Cash | 2.5% | 3.0% | 6.5% | Barclays 1 to 3 Year Treasury Index |
| Foreign Equity Developed | 8.0% | 18.0% | 7.0% | MSCI EAFE |
| Foreign Equity Emerging | 9.5% | 23.0% | 8.5% | MSCI Emerging Markets |
| Leveraged Buyouts | 12.0% | 23.6% | 15.0% | |
| Natural Resources | 8.4% | 23.9% | 6.5% | |
| Real Estate | 7.5% | 15.0% | 9.5% | |
| Venture Capital | 18.0% | 37.8% | 18.0% | |
| Total | 8.9% | 13.9% | 100.0% | |
| Source: Yale Endowment *Adds 2% to real return expectations to get nominal return estimates. |
||||