Every month, Foundation Advocate chooses one aspect of foundation investment performance to highlight.
This month we ask a very fundamental question, Who Should We Compare Ourselves To?
Before answering this seemingly straightforward question about performance, it might be useful to establish a quick framework to place performance into context. Rather than lead with foundations, we thought a more familiar group, Ivy League endowments, would help illustrate some core concepts.
Ivy League Endowments 5 Year Investment Performance

Absolute Performance, Relative Performance, and Peer Groups
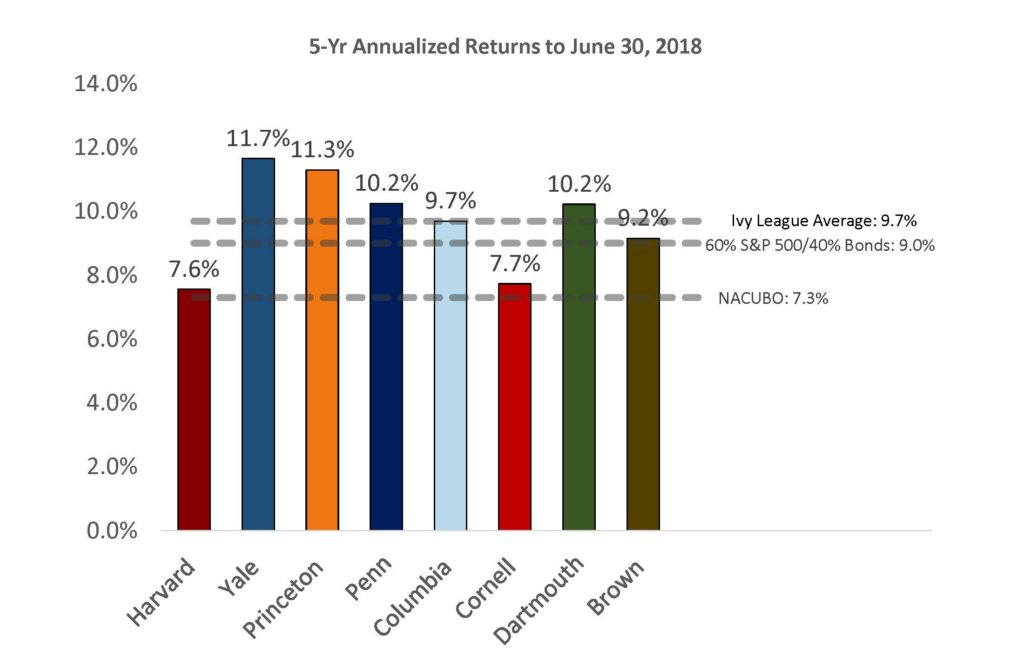
As the table above shows, Ivy League performance can be viewed in a variety of ways.
- Absolute return: Harvard was up 7.6% per year over the 5-year period, Yale returned 11.7%, Princeton 11.3%, and so on, it is clear to see which schools did better or worse.
- As a group: The Ivies averaged, 9.7% for the period as shown by the top hash marked line (“Ivy League Average”) in the chart. It is easy to see that Yale, Princeton, Penn, and Dartmouth outperformed the average, Columbia was in line, while Harvard, Cornell, and Brown trailed. It is important to note that the Ivies are a great example of a peer group, as they all have sophisticated investment committees, access to a rich assortment of investment products and asset classes.
- Relative to a 60/40 mix of stocks and bonds: The second hash marked line in the chart above (“60% S&P 500/ 40% Bonds”) shows the return of a passive portfolio invested in a traditional balanced strategy of 60% stocks and 40% bonds. The Bloomberg Barclays Aggregate Index is used for bonds, the S&P 500 represents the US stock market. (note: many institutions use a 70% MSCI AllWorld and 30% Bloomberg Barclays Aggregate – article pending). As one can see most of the Ivies beat the 9.0% returned by the passive portfolio.
- Relative to the overall college endowment universe: The third hash marked line from the top represents the performance of the overall college universe as reported by NACUBO, which returned 7.3% for the period. As one can see, all eight Ivies beat the average college. One can also see that the average college endowment trailed the passive 60/40 mix by a wide margin.
By offering multiple points of comparison, the chart offers a more complete view of Ivy League performance. If, for example a Dartmouth alum wanted to know how its endowment was doing, he could easily see that it outperformed the Ivy average, a passive mix as well as the average college.
Only with a fuller picture can the more interesting and useful questions be asked, like what can Harvard and Cornell do better? (Harvard did a clean sweep of it’s investment team 2 years ago).
So What About Foundations?
The same concepts above hold true for foundations. A meaningful answer to “How are foundations doing?” can only be addressed by answering it in the context of public market indices, average foundation performance, and representative peers.
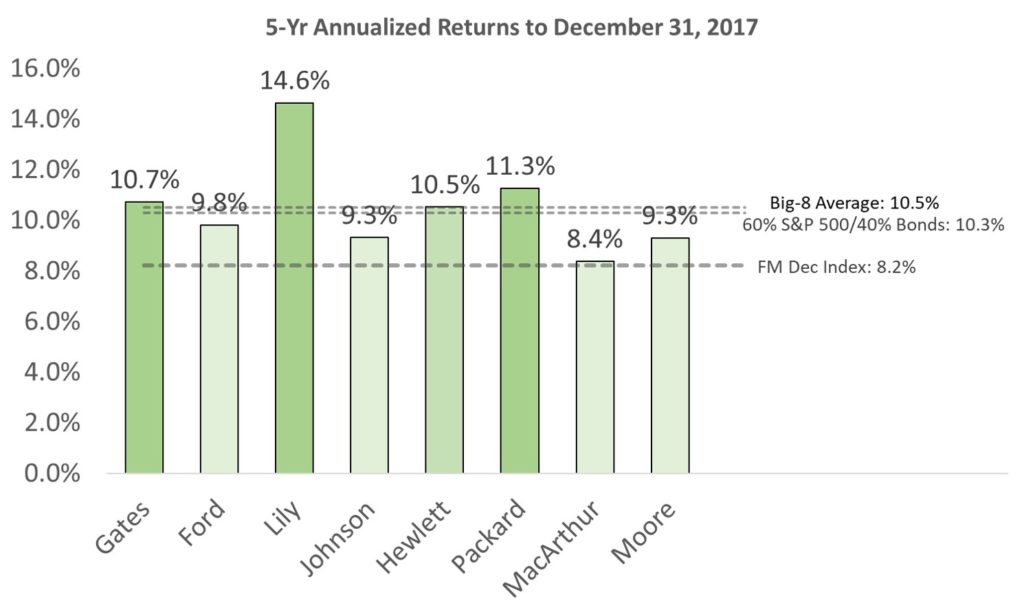
For example, below is a chart showing the estimated investment performance of a group of 8 of the largest foundations in the United States, the “Big-8”. (Note: unlike colleges which publicly disclose performance, foundations typically do not. The data below is provided by our parent company, Foundation Financial Research which publishes the FoundationMark indices.)
Eight of the Largest US Foundations 5 Year Performance

Note: Very few foundations disclose their investment performance. Among the eight in the chart, only MacArthur does on a regular basis. MarArthur’s calculated 5-Year return was 8.34%, Foundation Financial Research’s estimate was 8.39%, a difference of 5 basis points. The chart uses the FFR estimate for consistency with the other foundations. Ford did disclose their investment performance in 2016 but we haven’t seen an update for 2017.
It is important to note that these returns shouldn’t be compared to the colleges as they cover time different periods. (Note the difference in the 60/40 mix in the two charts). Colleges use a June fiscal year. Foundations can choose any month for their fiscal year-end, but the eight in the chart use the December calendar year end. Since foundations don’t have school colors, we color coded this based simply on which foundations outperformed the average in the group, darker green outperformed while lighter under-performed the average.
Foundations: Compared to What?
In the same way we looked at endowment performance, we can look at these foundations from a several angles.
- Absolute return: Lilly led the pack, while MacArthur trailed.
- As a group: The average of the eight was 10.5% for the period.
- Relative to a 60/40 mix of stocks and bonds: The Big-8 average edged out the passive 60/40 mix by 10.5% to 10.3%.
- Relative to the overall foundation universe: Over the period the FoundationMark December Index returned 8.2%, so the group did significantly better.
Now let’s return to the base question of, How are foundations doing? A terse answer could be that the average foundation was up 8.2% per year. Alternatively, one could say that the average foundation trailed a passive portfolio with a 60/40 mix by 2.3%. Yet another, albeit vague, answer could be that some foundations, like Lilly and Packard did well, while others did less well. In short, it is only by gathering data that a fuller picture can be seen.
Foundation Advocate Observations
- Big beat small
- Both groups of foundations and endowments were made up of some of the very largest by asset size. In both cases, the peer averages were significantly higher than the average endowment or foundation. (Article pending).
- Passive beat average
- The 60/40 mix outperformed the average endowment (NACUBO) and foundation (FoundationMark December Index) significantly. (Article pending).
- Variance
- It is interesting to note the wide performance swings, even among very small groups of similar organizations. At first glance, the difference of just over 4% between the best and worst performing endowments in the Ivy League might not seem a lot, however it translates to over 20% over 5 years, and billions of dollars. The difference in foundations is even greater, nearly 6% annually, or 32% greater cumulatively, again translating into billions of dollars more available to support important causes for the better performer. (article pending).
How Is Our Foundation Doing?
Knowing how foundations as a group are doing is important, but it is far more important for trustees to know how their performance stacks up in absolute terms, relative to market indices, foundations overall, and peers.