Every month, Foundation Advocate chooses one topic relating to foundation investment performance to highlight.
This month we took a look at how international stock allocations have likely held back foundation performance.
Why Haven’t Foundations Done Better in this 10 Year Bull Market?
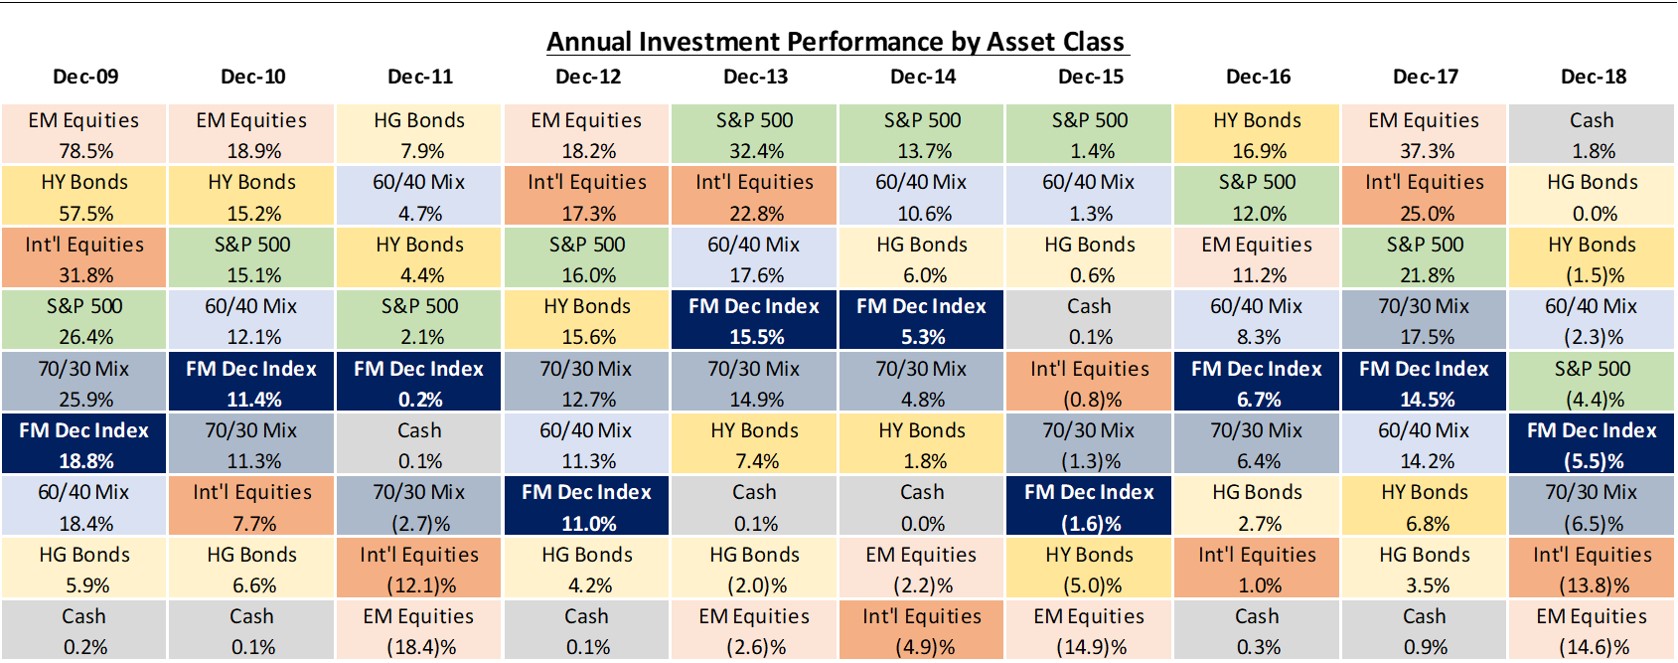
Following the financial crisis, the US stock market has been on a pretty great 10-year run with only a few hiccups. The S&P 500’s annualized return for the decade ending December 31st, 2018 was 13.1%. How have foundations fared over the same time frame? Not nearly as well, the preliminary 10 year estimate from FoundationMark shows a 7.4% annualized return for foundations, the BNY US Master Trust reported similar performance, up 7.9% annually from its subset of larger foundations.
Historically foundations’ default allocation was a 60% in stocks (S&P 500 Index) and 40% in bonds (Bloomberg Barclays US Aggregate). Over the 10-year period, the 60/40 portfolio returned 9.4% annually. What changed? A partial explanation might be pretty simple…..international stocks and hedge funds.
What do Foundations Own?
As the Foundation Advocate has noted in other articles, foundation asset allocations runs the gamut from Crypto currencies to 100% cash with everything in between. While foundations are not required to disclose the proportion of their equity holdings that are in international or emerging markets or specifically in hedge funds, there are industry surveys that poll foundations. One of the best surveys on foundation asset allocation comes from the Council of Foundations and Commonfund (“CCSF“). The CCSF data (summarized below) shows that from 2011 to 2017 (the most recent available) international equities increased from 12% of assets to 21% while US stock exposure stayed flat at about 25%, hedge funds were around 15% throughout the period.
Allocation Decisions
Before getting into performance, have a second look at the chart above on the right. It show a fairly consistent allocation among these three asst classes over the 7 year period. One might draw the conclusion that all was going according to plan, which seems surprising as performance continued to lag the the 60/40 in a significant way.
Now let’s look below at a “periodic table” of asset class returns for the past 10 years. It’s a lot to take in, but don’t worry, we will simplify things as we go along. The boxes in darker blue with white font are the FoundationMark returns representing median foundation returns, which you can see tend to be in the middle/lower middle of the pack each year (more on that in a future article).
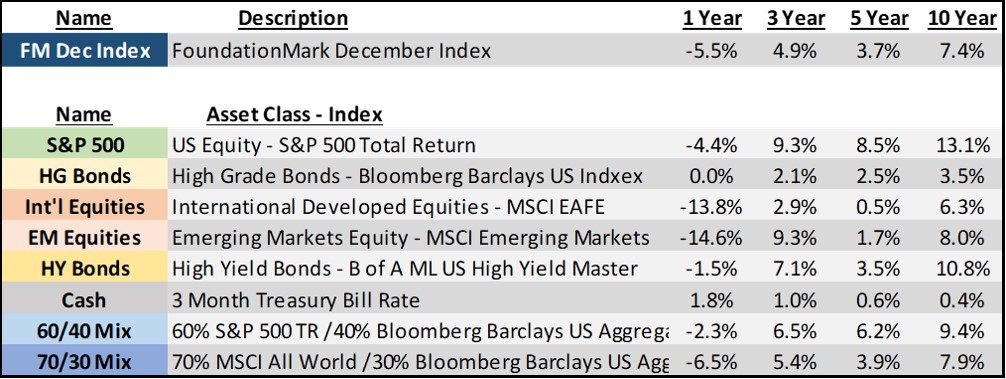
Index Description and Multi-Year Period Returns to December 31, 2018
As you can see over the 10 years, the S&P 500’s 13.1% annual performance was the best among these major asset classes, returning more than twice MSCI EAFE (international developed markets). In the 5-year period, US bonds did better than both EAFE and emerging market stocks (MSCI EM).
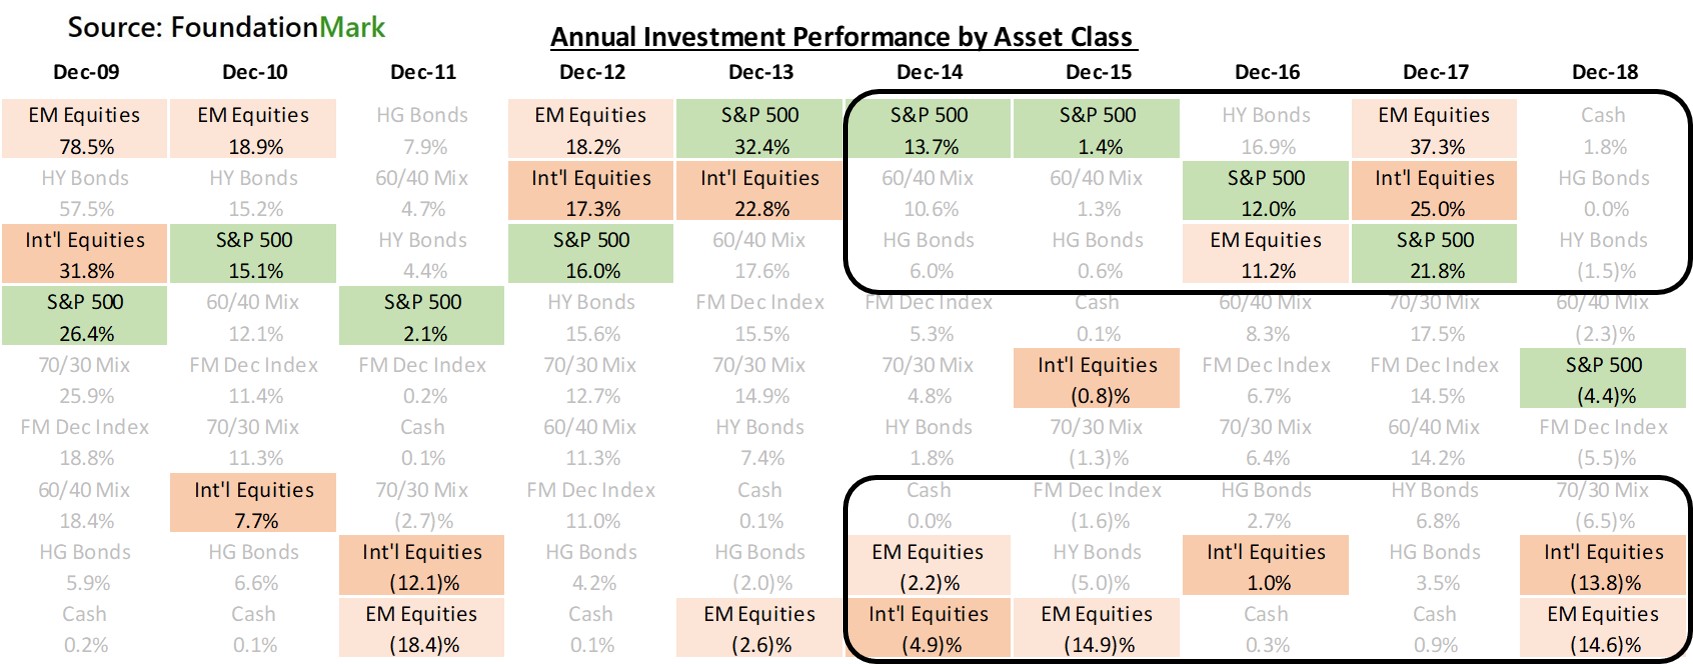
The view below may be easier to see the relative performance of US versus international equity markets. In the past 5 years, the S&P 500 was in the top 3 asset classes 4 out of 5 years, Emerging Markets 2 of 5 and Developed Markets just once. At the other end of the spectrum, one can see that both Emerging Markets and Developed International were among the worst performers 3 out of 5 years each. Additionally, international stocks often trailed by wide margins, such as the period 2013-2016 when the S&P was at or near the top each year and international/emerging alternated for last place and trailed cash all but 1 year during that stretch.
As we noted above, international and emerging market returns were negative for much of the past 5 years, while US stocks posted solid gains. Logically, it follows that the only way to maintain or increase one’s allocation was by selling US stocks and buying international ones, or selling winners to buy losers.
Foundations Allocation to Hedge Funds
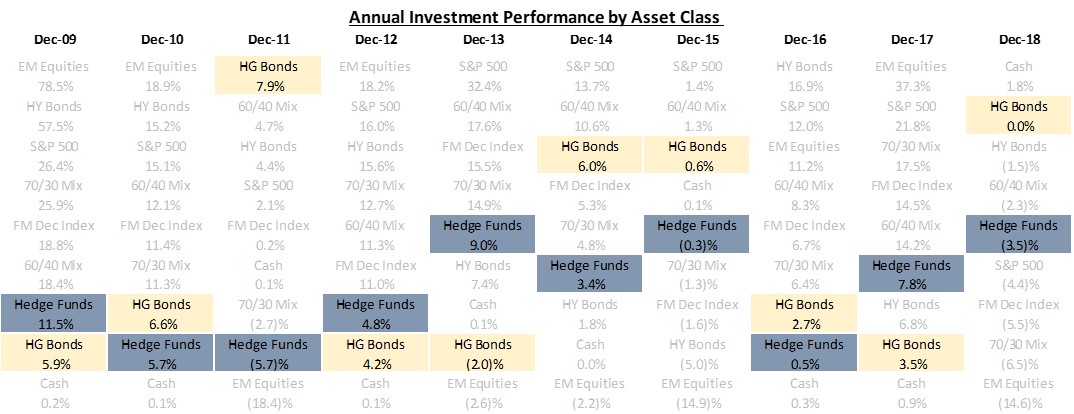
As the allocation chart and graph at the beginning show, many foundations had a significant allocation to hedge funds. This was another asset class best avoided for much of the past 5 years. The table below highlights hedge fund returns (HFRI Index) in comparison with bonds (Bloomberg Barclays US Aggregate Index). As you can see investors would have been better off in bonds 4 of the past 5 years, as well as cumulatively throughout the 10 year period.
Understand Your Bets
As we noted above, foundations that maintained their exposures to the US and international markets or to hedge funds were probably selling US stocks to do so. We have no crystal ball, and this may well work out in the long term. However, it bears noting that 10 years is a pretty long time to stay in a bad trade.
A reader may conclude that Foundation Advocate is looking to make a point about international equities or hedge funds – which is simply not the case. We just followed the data. The next 10 years could be the complete opposite with hedge funds and international leading the charge – we don’t know, that is not our job (it is however the job of the foundations’ money managers). Our intent in writing this was to understand more about reasons foundations may have missed out on much of a historic US bull market.
Learning from your mistakes (or other people’s mistakes) is an essential part of becoming a better investor. Knowing what you got right and what you got wrong is an important part of the the process of preparing for tomorrow’s investment opportunities and challenges.
Foundation Advocate does not offer any investment advice, but we will say this – pay a great attention to your asset allocation decisions, as they are bound to shape your foundation’s performance and by extension the amount of support it can provide.


