News and Analysis of Foundation Investment Performance
State Overview: Illinois
By
All data used in rankings and calculations is provided by FoundationMark and FoundationIQ and reflects foundations with over $1 million in assets.
Overall Ranking by State
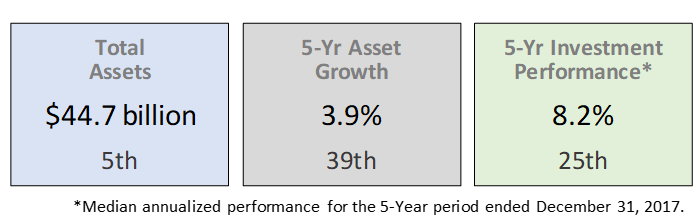
Illinois foundations reported total assets of $44.7 billion, ranking 5th among states.
Illinois foundations 5 year total asset growth of 3.9%, ranked 39th.
The average 5-year annualized return of Illinois foundations for the period ended December 31, 2017 was 8.2%, 25th place.
Asset Development
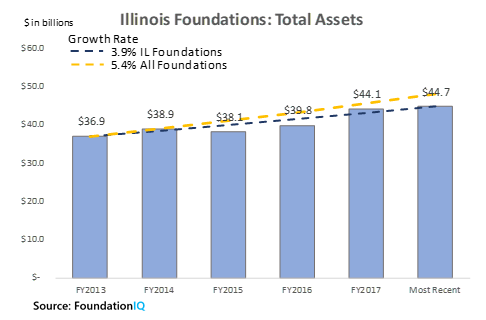
Since 2013 Illinois foundations assets have increased by $7.8 billion from $36.9 billion to $44.7 billion.
Illinois’s growth rate (blue hashed line) of 3.9% was slower than the overall foundation universe growth rate (yellow hashed line) of 5.4%.
Investment Performance
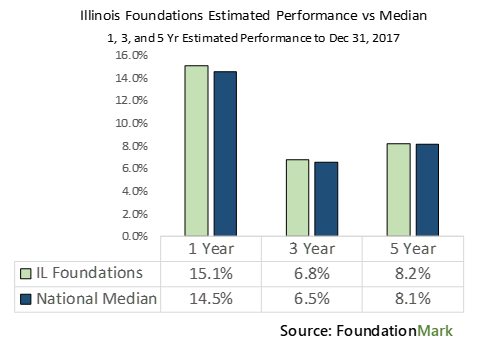
Illinois foundations estimated median performance for the1-yr, 3-yr, and 5-yr periods ended Dec 31, 2017 was 15.1%, 6.8%, and 8.2% respectively.
For the five year period, FoundationMark estimates Illinois foundations performed in line with the overall U.S. foundation universe.
Disclosed Investment Expenses
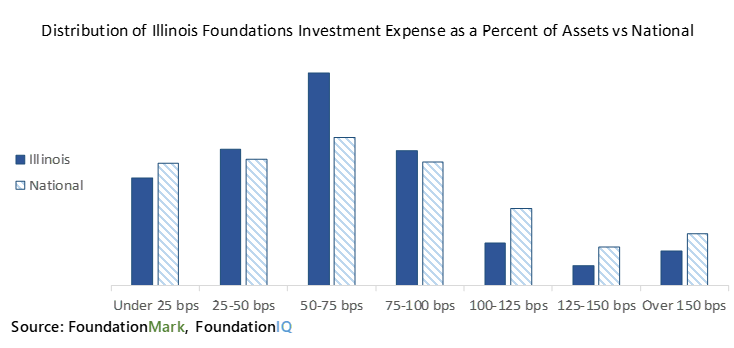
Illinois foundations reported $212.5 million in disclosed investment expenses for the most recent year.
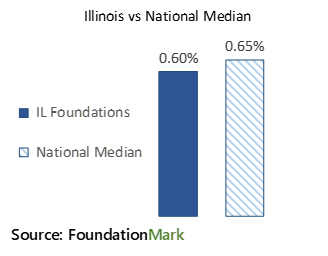
Median investment expenses for Illinois foundations of 60 basis points were 5 basis points lower than the national median of 65 basis points, moderately better than most other states.
The chart below shows that most Illinois foundations were in the 50-75 basis point range, and that fewer Illinois foundations have high investment expenses compared to the overall market (columns on the right).
Basis Points (bps): Investment fees are usually quoted as a percentage of assets. For example an investment manager may charge a 0.75% fee to manage the money that you have with the firm. The term ‘basis point’ is an easier way to say small numbers by moving the decimal point two places to the right. so 0.75% = 75 basis points, for the simple reason it is easier to say out loud “seventy five basis points” than “zero point seven five percent”.
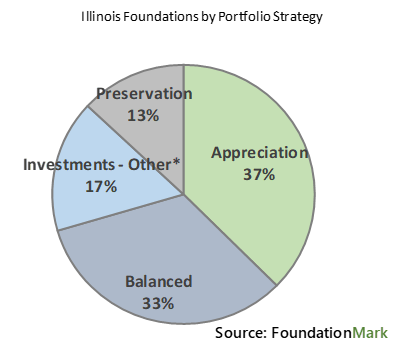
Foundations by Portfolio Strategy
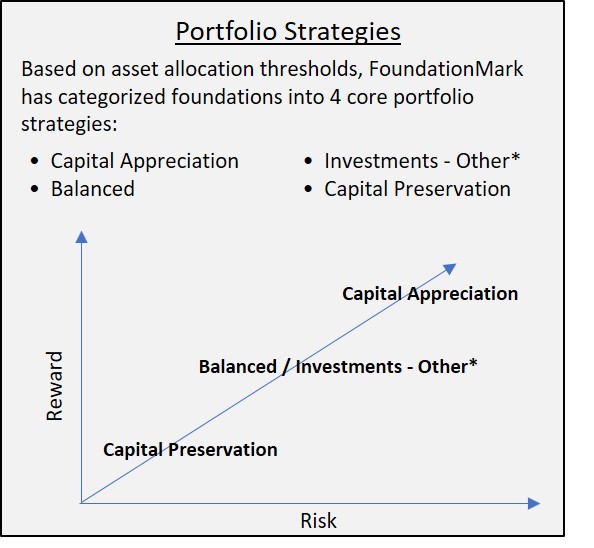
FoundationMark Portfolio Strategies
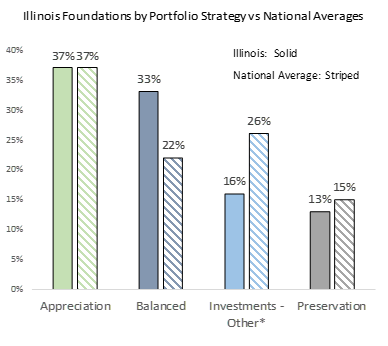
37% of Illinois foundations were categorized as Capital Appreciation by FoundationMark, in line with the national average.
33% of Illinois foundations had a Balanced strategy, 11% higher than the national average.
16% of Illinois foundations were categorized as ‘Investments – Other’, 10% lower than the national average.
13% of Illinois foundations had a Capital Preservation strategy, a little lower than the national average.
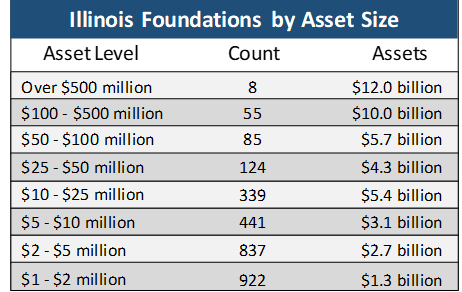
There are close to 2,800 foundations in Illinois with over $1 million in assets.
Illinois has 3 of the top 100 foundation by asset size in the US.
Over 270 Illinois foundations have assets of over $25 million.
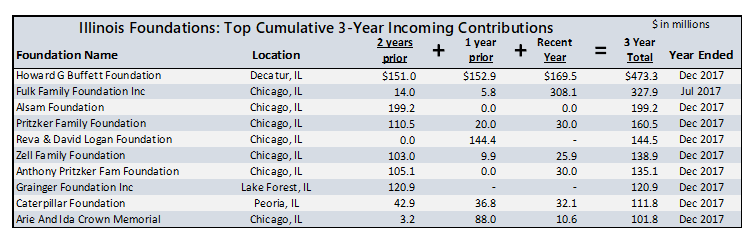
Top 10 Foundations by Assets
The biggest foundation in Illinois is the MacArthur Foundation which is also among the largest foundations in the country and is included in the FoundationMark 15.
Foundations by County and City
Incoming Contributions
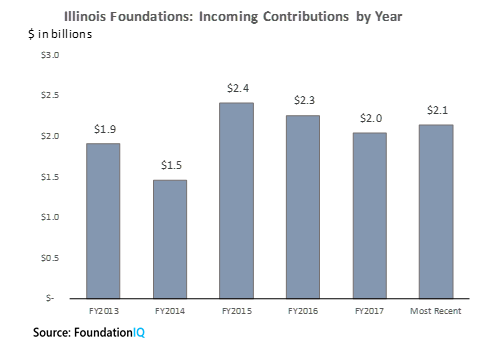
Illinois foundations received $2.1 billion in incoming contributions in the most recent year, and $10.1 billion cumulatively over the past 5 years, fifth most of all states.
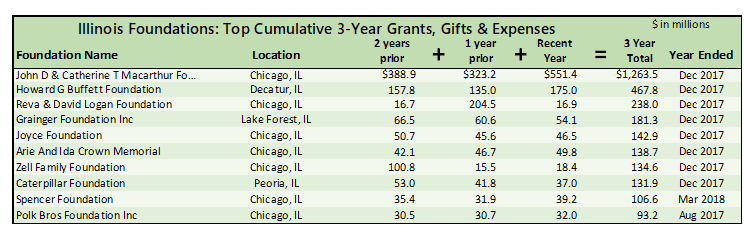
Grants, Gifts and Operating Expenses
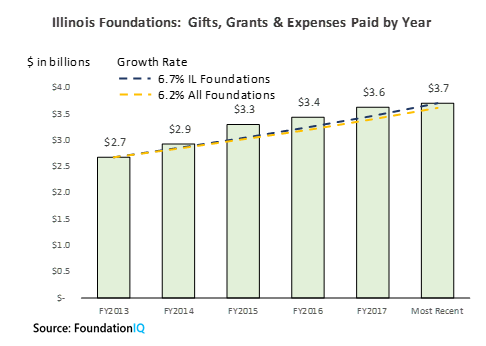
Illinois foundations paid $3.7 billion in grants, gifts, and operating expenses in the most recent year, and $16.0 billion cumulatively over the past 5 years, fifth largest in dollar terms.
Illinois giving growth of 6.7% per year was faster than the national average of 6.2%.
If you would like to learn more about over 2,800 foundations in Illinois that we follow, or the other 40,000 foundations outside of Illinois that we track, including performance and expense data, please visit our affiliated companies