News and Analysis of Foundation Investment Performance
Second Quarter Investment Performance
By
First Half Rebound
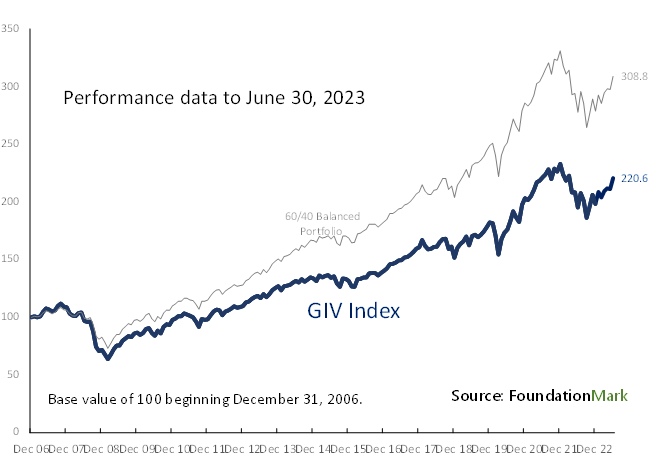
The Grantmaker Investment Value Index (“GIV”) rose 5.3% in the second quarter after a similarly strong first quarter, bringing estimated year-to-date performance to 11.3% in the first half of 2023. Foundation investment performance annualized at 6.6% per year for the ten years ended June, 2023, ahead of the required 5% payout ratio, but still well below the 60/40 mix (the traditional mix of 60% S&P 500 and 40% Bloomberg Aggregate Index) performance of 8.5%. While the difference of 2% might seem modest, over 10 years it accrues to about 40% of cumulative underperformance.
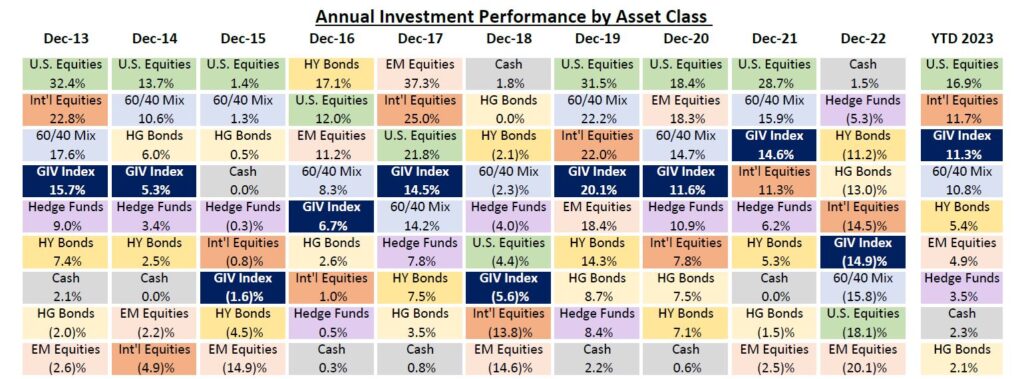
Strong equity markets in the U.S. – up nearly 17% – were the primary driver of first half performance. International developed markets also contributed to the strong performance, gaining 11.7% in the six month ended June 30, 2023. Emerging markets have continued to be the weakest major public market equity asset class, advancing just under 5% in the half (less than 1/3rd the U.S. market’s gain).
U.S. high grade bonds fell just under 1% in the second quarter, but are in positive territory for 2023, though still trailing cash returns of 2.3% for the year-to-date. High yield bonds were up over 5% in the first half.
Asset Class Returns
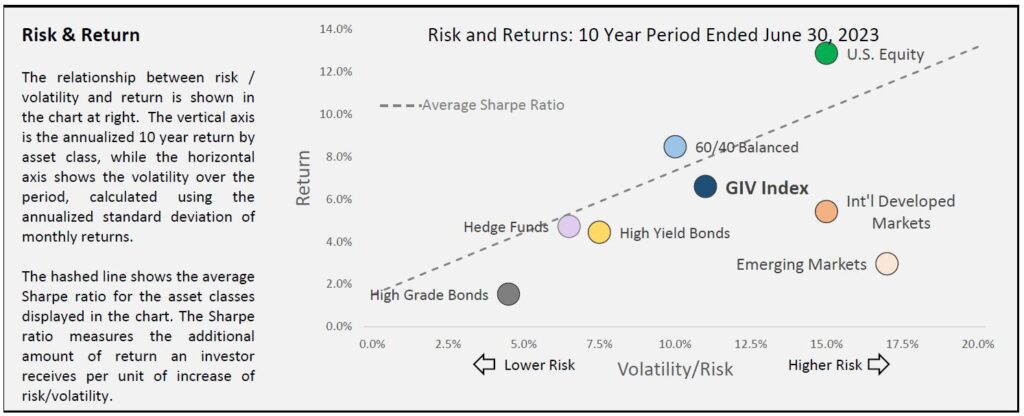
Risk and Return
The chart below shows the relationship between risk and return. In the chart risk is defined as volatility (shown on the x-axis) and return is plotted on the y-axis. Asset classes out to the right (International and Emerging Markets) are more volatile than those closer to the axis (High Grade Bonds). As one can see, over the 10-year period, U.S. Equities were the strongest performer, up 12.9% (y-axis). The dotted line shows an approximation of the average Sharpe ratio which is a measure of risk weighted return. Asset classes above the line delivered better risk/return than those below. U.S. Equity was the lone outlier over the period (which also drove the 60/40), with Hedge Funds a solid second place.
As one can see Emerging markets were a poor asset allocation choice for the decade, with annualized returns of just 3% and volatility greater than U.S. Equity markets.
Over the 10-year period to June 2023, U.S. equities delivered more than twice the return of international stocks with similar risk.
The FoundationMark GIV Index is calculated using FoundationMark return estimates up to and including December 2022 thereafter monthly returns are estimated based on reported asset allocations and market returns. The GIV Index serves as a proxy for foundation performance. Actual performance may differ materially. The GIV Index is updated on a continuing basis and all data is subject to revision.
The 60/40 Balanced Portfolio represents the traditional institutional allocation to equities and fixed income with weightings of 60% in the S&P 500 and 40% in the Bloomberg U.S. Aggregate Index, rebalanced monthly.