Footer
Are you a trustee?
Interested in a free FoundationMark report on your foundation’s investment performance? click here
Contact Details
E-Mail: info@FoundationAdvocate.com
By
FoundationMark, has recently rolled out a new feature – peer group analysis.
Foundations have been badly underserved in terms of available financial benchmarking resources. The few publications available tend to either 1) focus on only the largest foundations, 2) be buried in academic papers, or 3) report episodic survey results, all of which make it difficult to make meaningful comparisons to similar sized foundations.
FoundationMark approached the lack of representative peer groups from a different perspective. With a complete database of the full financial statements of all foundations with over $1 million (over 40,000 in total), FoundationMark is able to construct the most comprehensive peer groups ever assembled. Furthermore, the underlying data is updated continuously as new data becomes available, keeping the peer groups fresh and relevant.
Perhaps the easiest way to get a feel for peer group data in action is to walk through an example. Suppose you are a trustee of a foundation with $20 million in assets.
As seen below, you may be surprised to learn that there are over 5,000 foundations with similar asset levels – combined $80 billion in total assets, providing close to $8 billion in philanthropic support.
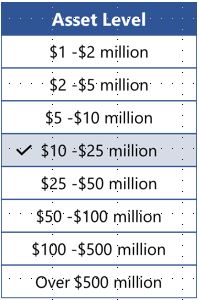
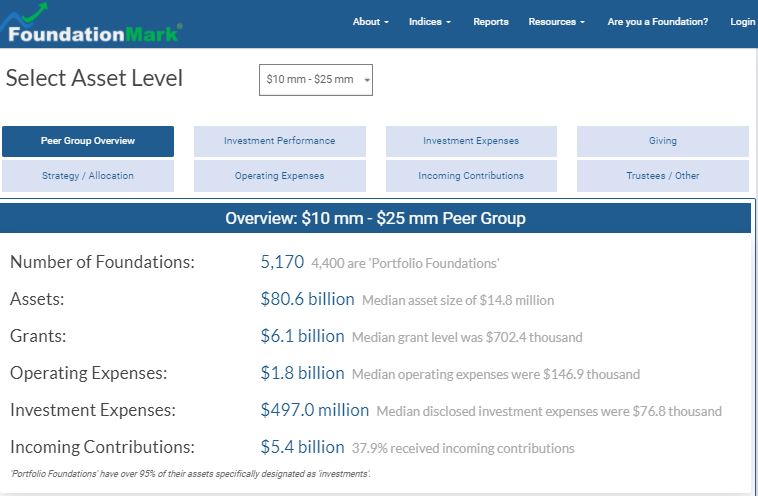
One question that many trustees have is “how are we doing compared to other foundations?” This is a subject where one size does not fit all. There are significant differences based on asset level and portfolio strategy (more on strategy below).
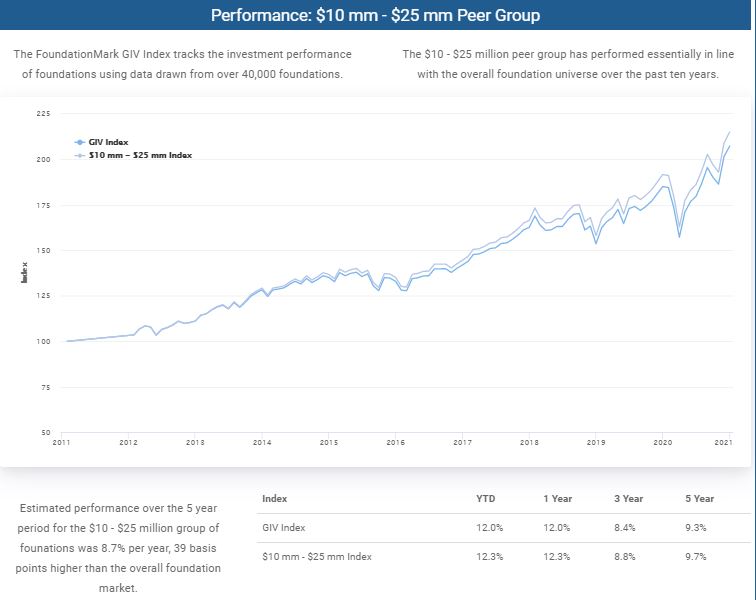
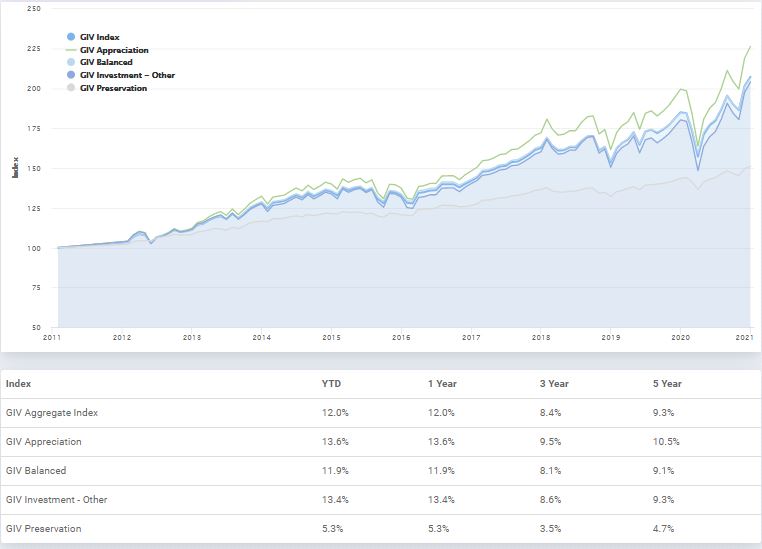
As you can see from the graph above and chart below, the $10 – $25 million peer group performed a little better than over all foundations (the GIV index).
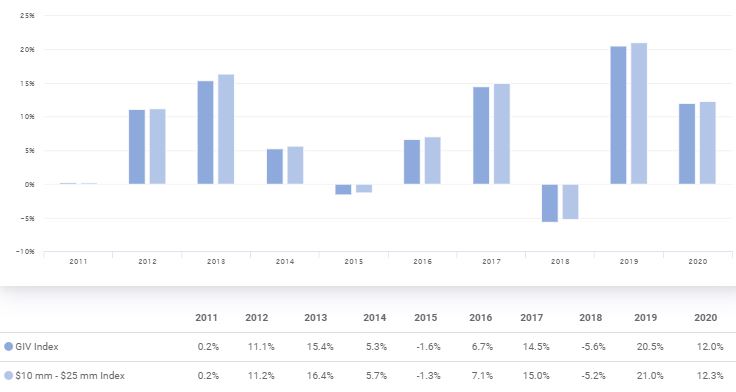
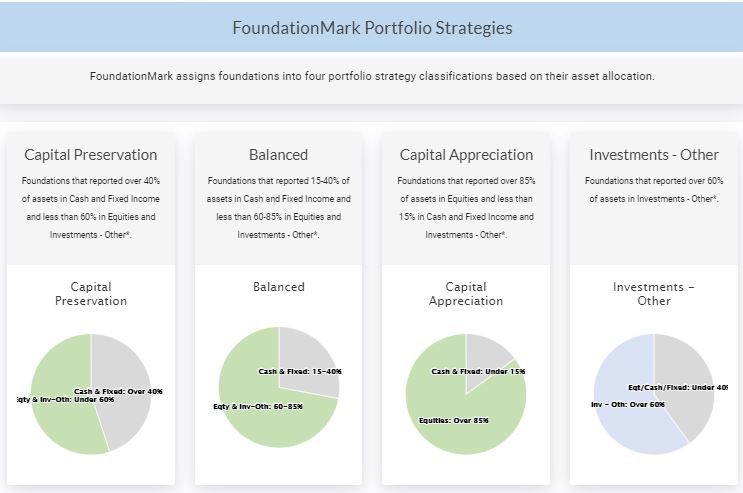
If one were to hear “larger foundations outperformed smaller foundations”, one might draw the conclusion that the investment teams at larger foundations are simply better investors. However upon hearing a similarly broad statement like “portfolios with higher exposure to stocks did better than those with lower exposure to stocks” reveals that factors other than size play a more meaningful role and this simple reframing demonstrates the need to look past asset levels in looking at performance. FoundationMark assigns foundations to four portfolio strategies based on their reported holdings.
Over the past decade, Capital Appreciation foundations (those with over 85% in equities) performance was more than double Capital Preservation foundations (those with over 40% in cash and bonds).
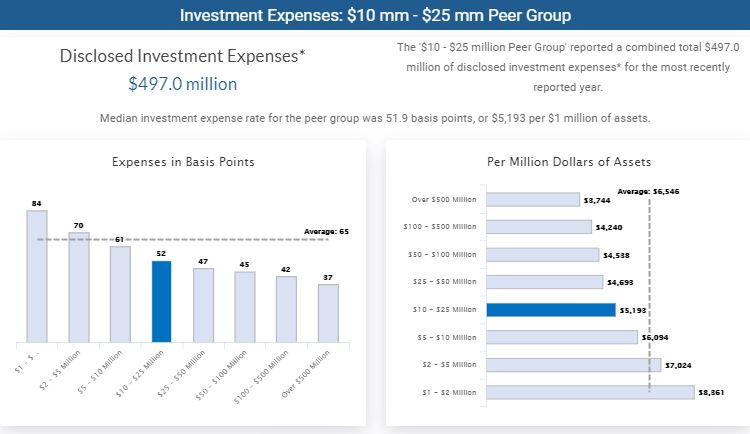
Many trustees want to know if their investment management fees were are in-line with their peers. As seen below, foundations in the $10 – $25 million peer group reported about 52 basis points ($5,191 per $1 million) in investment expenses. In our hypothetical $20 million foundation, this would equate to about $100,000 in fees.
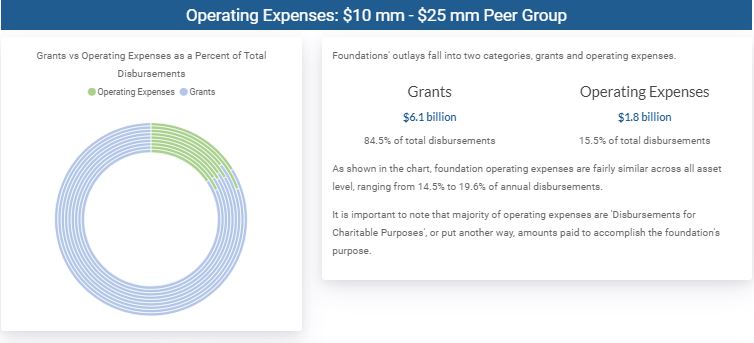
At the beginning of this note, we pointed out that foundations in the $10 – $25 million peer group provided close to $8 billion in philanthropic support. The grants and operating expense section in FoundationMark’e Peer Group section drills down on where the money goes,
In the chart below, one can see that the $10 – $25 million peer group paid out $6.1 billion in grants and $1.8 billion (or 15.5% of total outlays) was consumed by operating expenses, which includes charitable work the foundation may do on its own.
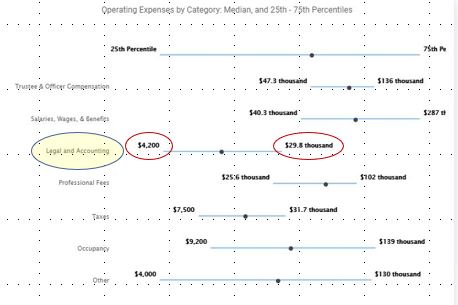
Foundations’ operating expenses can vary based on their missions. FoundationMark provides ranges and medians of expense categories by asset level. For example in the chart below, our selected $10 – $25 million peer group had a range of accounting and legal fees (yellow bubble) between $4,200 and $29.8 thousand (red circles) in the 25th to 75th percentiles. Median legal and accounting fees were about $11 thousand (dot on line) Put another way, half of the foundations paid between $4,200 and $29,800, while a quarter paid less than $4,200 and a quarter paid more than $29,800 for legal and accounting.
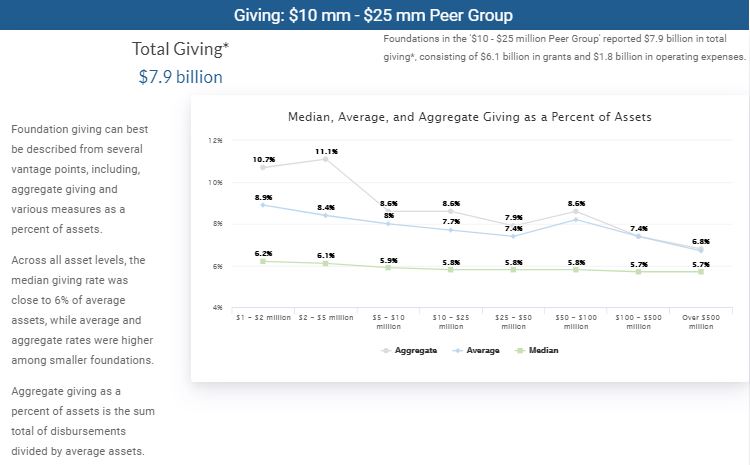
Many people assume that foundation giving levels hug the 5% mandated minimum. We have seen that this isn’t the case, especially among smaller foundations, In fact, the median rate is typically closer to 6%, and average and aggregate payout rates are significantly higher, especially among smaller foundations,
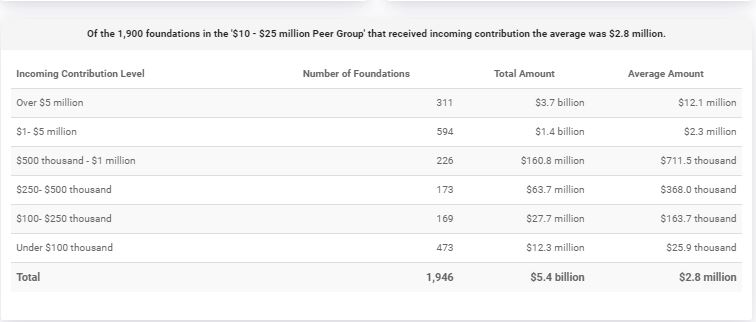
One area that is often overlooked is incoming contributions. Many observers think of foundations as a static entities, funded by a benefactor, designed to provide philanthropic support in perpetuity based on future investment gains and this traditional scenario accounts for a significant number of foundations, However, many other foundations can be seen as having life cycles with new donations coming in and new foundations starting and some spending down or closing. Over one third of all foundations received incoming contributions in the most recent year, even more (nearly 38%) in the $10 – $25 million cohort received incoming contributions,
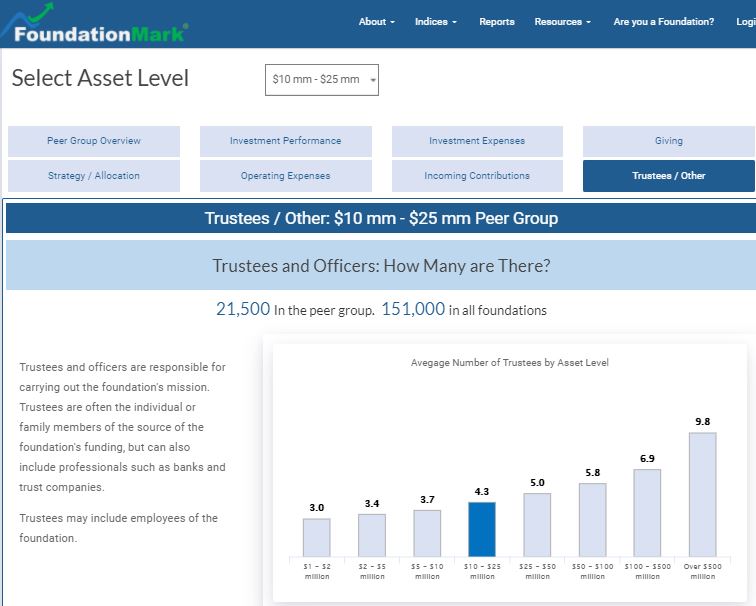
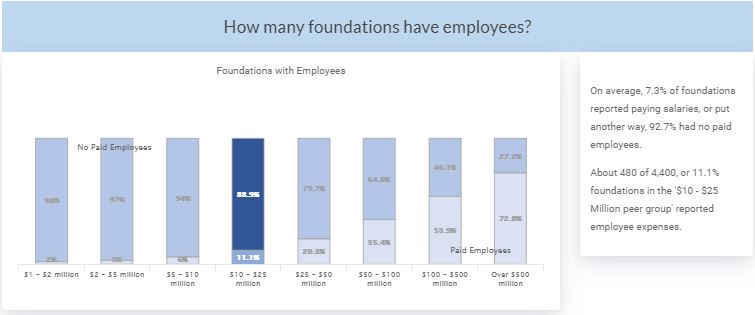
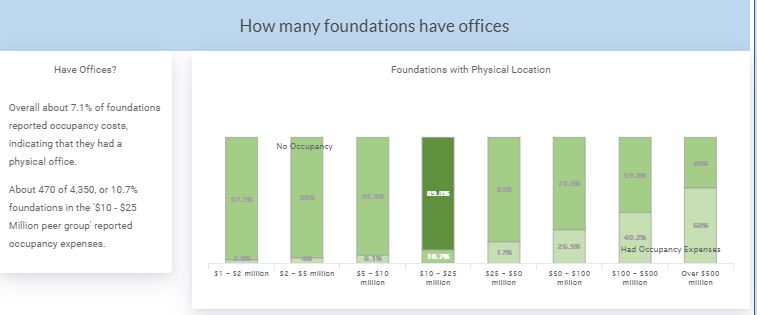
We began this note with the hypothetical trustee wondering, “are there foundations like ours?”. And in this last section, we provide a bird’s eye view of foundations’ structure in terms of number of trustees, whether they have employees or physical offices.
Comparing the largest foundations, those with over $500 million with the other asset ranges, shows while the majority of the largest have offices and employees, the percentage drops significantly among the smaller cohorts.
Returning finally to our hypothetical trustee at our imaginary $20 million foundation, he or she might be interested to learn that there are over 20,000 other trustees of similar sized foundations that might have many of the same questions, challenges, or solutions as their peers.
FoundationMark peer groups provide foundation trustees and the broader nonprofit community with tools and resources to help understand important metrics in the $1.2 trillion foundation universe.
Interested in a free FoundationMark report on your foundation’s investment performance? click here
E-Mail: info@FoundationAdvocate.com