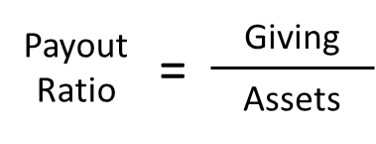
One would think that calculating a payout ratio is a very straightforward task. You just need a numerator and a denominator, therefor simple division leaves you with a ratio. For example, if you wanted to know a baseball teams winning percentage, you take the number of games won, divide by number of games played, and viola, you have a ratio. Naturally it follows, that if you wanted to know a foundation’s payout ratio, it is a simple matter of looking up a numerator (giving) and dividing by a denominator (assets).

Presto, you have your payout ratio! Or do you? As the saying goes, the devil is in the details. In this case it’s a matter of defining giving and assets.
The critical elements that need to be defined are; 1) how much did the foundation give to charity and 2) how much money is in the foundation.
For most foundations, this calculation is easy, but on occasion it can be tough to define exactly what “giving” is as well as what “assets” are. Below we will give a few examples to illustrate these concepts, and how they can lead to confusion. Before launching into a discussion of payouts, it is important to acknowledge the source of the data, which is a specific tax form, the 990 PF (“PF” for Private Foundation), which foundations must file every year with the IRS.
The IRS Approach or Unapproach
Let’s begin with a simple truth, the term “payout” does not actually appear in the form 990 PF and the term “ratio” only appears once, and has been discontinued.
Without getting into tax law, the crux of the bargain between the IRS and a foundation’s donor(s) is that the donor(s) gets a big tax write-off when funding the foundation and in return the foundation must pay out at least 5% of its assets per year. Foundations must show that they are keeping up their end of the bargain by recording the amount and where their donations dollars are going as well as reporting on the fair market value of their assets. Naturally, these two numbers provide the basis for a payout ratio. One would think that there would be a line on the tax form that asks for this exact calculation, but there isn’t.
The closest wording in the form is the decidedly more cumbersome “Part V Qualification Under Section 4940 (e) for Reduced Tax on Net Investment Income” which can be found on page three of the form with a table containing “Adjusted qualifying distributions” (numerator) and “Net value of noncharitable use assets” (denominator). This is the one time the word “ratio” appears in the form. However, this ratio wasn’t used as a litmus test to see if the foundation paid the 5% hurdle, it was used to determine whether the foundation owed 1% or 2% of its net investment income in taxes. You may have noticed we used the past tense when discussing the distribution ratio. The tax reduction benefit was repealed as of December 31, 2019, and this section is no longer part of the form 990 PF, so presumably, foundations will no longer report any ratio at all.

Similarly, the one place that “5%” appears in the tax form is on page 8 in reference to “minimum investment return”, which is then used to calculate “distributable amounts” and finally comparing it to “qualifying distributions”. As anyone who has looked at tax forms can imagine there are a series of steps such as “subtract line 2 from line 1d” and insert “total from Part I, column (d) line 26” to arrive at an “adjusted qualifying distributions”, the numerator in the formula above, yet there is no calculation in the tax form for the current year’s distribution ratio.
Since foundations are not required to calculate a payout ratio, it might not surprise you to see why something so simple can actually be a little complex without proper definitions.
Adjusted Qualifying Distributions as Giving? No.
Since the only ratio historically required by the IRS is the distribution ratio, one might assume that the numerator – “adjusted qualifying distributions” would be a good proxy for giving, right? Not exactly.
The core problem with using “adjusted qualifying distributions” is that it includes taxes. The easiest way to illustrate this problem is by example. Take a simple foundation that made $1 million in grants and had no other charitable expenses. Any reasonable person would say that the foundation paid out $1 million, so therefor giving is $1 million. However, if one were to make the “adjustments” to arrive at “qualifying distributions”, that $1 million might be higher or lower based on net investment income. Specifically if the foundation had $10 million in investment income, the “adjusted qualifying distributions” could be, and this is where it gets crazy, either $800,000 or $900,000, depending on the size of the foundations assets. If the foundation had no investment income or lost money, “adjusted qualifying distributions” would be $1 million. In any of these scenarios, the same $1 million went out the door to charity.
We believe that giving should be defined as it appears on the first page of the 990 PF, “disbursements made for charitable purposes”. Therefor, we have a numerator.
Denominator: Average Investable Assets
While the denominator in the IRS disbursement ratio makes more sense than the numerator, it requires a number of steps involved in its calculation, beginning with monthly fair market value of securities, then adding and subtracting various items to arrive at a value for the “net value of noncharitable-use” assets”, or in layman’s terms this can be interpreted as “investments”. One place the IRS calculation seems arbitrary is that it calls for 1 1/2% of assets to be excluded from the asset base, earmarked as “cash deemed held for charitable activities”.
We believe that a more intuitive and transparent methodology is to simply add the fair market value of investments at the beginning of the period and average it with the fair market value at the end of the period.
Example: Carnegie Payout Rate
Page 8 asks foundations how much their monthly average FMV of securities and cash (some cash excluded) and multiplies 5% to get “minimum investment return”, then you take the taxes (2% of 27b and subtract. If you are higher 26 d
No penalty, if lower penalty, but its usually and adjustment
5 year number is used to calculate whether 1 or 2%
https://www.ncfp.org/wp-content/uploads/2018/09/The-Five-Percent-Minimum-Payout-Requirement-COF-2000-the-five-percent-minimum-payout-requirement.pdf
The table has a five year history which is used to calculate an “average distribution ratio for the 5-year base period”.

In practice, for most foundations that are purely grantmaking in nature the “net value of noncharitable-use assets” is simply their assets, and the “adjusted qualifying distributions” is the grants they make and any expenses that are charitable in nature, for example an employee who evaluates grant proposals.
Example: Carnegie Corporation of New York
One of the biggest and best known foundations in the world is the Carnegie Corporation of New York. Carnegie reported the fair market value of its total assets to be $3.44 billion as of September 30, 2109. The foundation reported total disbursements of $199.9 million, investment expenses of $5.9 million and total disbursements for charitable purposes (cash basis only) of $181.5 million or the year. So what is the distribution ratio?
Numerator
The starting point for the numerator is the total disbursement for charitable purposes, which includes cash value of grants paid as well as qualifying expenses. Investment expenses, depreciation, and most taxes are not included. The starting point for Carnegie is $181.5 million. The IRS calculation lowers this by $2.7 million to $178.8 million reflecting a 1% tax on net investment income
.
Denominator
The starting point for the denominator is a little more involved. It starts with the monthly average value of securities and cash, and then sets aside 1 1/2% of this amount as cash deemed held for charitable activities. It is important to note that if the foundation holds assets, like a museum, these assets are not included. In the case of Carnegie, it had a monthly average of $3.44 billion in securities and about $50 million was deemed cash held for charitable purposes, so the net was $3.39 billion.

Distribution Ratio vs Payout Rate
While it is easy to use the terms “distribution ratio” and “payout rate” interchangeably, one may argue that in the absence of an IRS definition of payout rate, the preferred “payout rate” method might make two slight modifications to the distribution calculation. The first is in the numerator; in the IRS method, the “adjusted qualifying distributions” removes either 1% or 2% of net investment income from the amount that the foundation reported in grants and charitable activity. As we saw in the Carnegie example, the foundation reported $181.5 million in charitable support, which was then trimmed by $2.7 million to arrive at the “adjusted qualifying distribution” figure. The $2.7 million reflects a tax liability that has no impact on dollars to charities, which stood at $181.5 million. The second adjustment is to the denominator. The IRS method assumes a level of cash that is excluded from the calculation, which seems arbitrary. Additionally, the IRS method calls for foundations to report the monthly average value of their securities, which is cumbersome for foundations to record. A simpler approach would be to use the average actual value of investable assets at the beginning of the year and end of year. It is unlikely that that there will be much difference between the distribution ratio and the more robust payout ratio.
Example: Carnegie Payout Rate
Carnegie’s payout rate was 5.18% for the year ended September 30, 2019, ten basis points lower than the IRS distribution ratio.

The Trouble with Averages
The next complicating matter in discussing payout rates is the use of the term “average”. Many people want to know how much foundations payout each year on average. What people often miss is that there are some foundations that can skew results significantly. The easiest way to understand this is with an example.
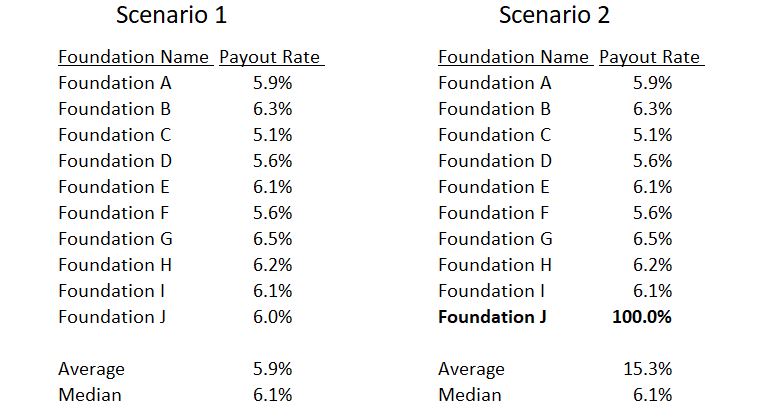
Suppose you have a group of ten foundations, with typical payout rates of about 5 or 6%, (scenario 1, below at left), an average is a meaningful metric. But look what happens to the average when one foundation, Foundation J, decides to wind down (scenario 2). The group’s average jumps from 5.9% to 15.3%. Notice that the median is unaffected, which is why most studies only focus on medians, though this decision can also obscure understanding payouts, which we will address below.

While not many foundations wind down in a year, a substantial number (about 3,000 or 7%), have very high cash flow compared to their assets. For example, the Bank of America Charitable Foundation paid out $169 million in grants in 2018, off a base of about $60 million in assets, ending the year with about $10 million, with the difference funded by incoming contributions of $120 million, making the distribution ratio was 733%, which would clearly play havoc with any calculation o average.