Last summer our research indicated that foundation assets crossed the $1 trillion threshold for the first time at some point in 2017, about 18 months prior to our discovery. Curious to learn more about this watershed moment, we looked for news stories but found none. After triple checking all our data, we mentioned this to the leading philanthropic publication, the Chronicle of Philanthropy, who (after confirming our findings with industry sources) wrote an article about it.
This event caused us to wonder Why did it take 18 months to discover foundations had cracked the trillion dollar barrier? Or more broadly, Why isn’t anyone tracking foundation assets in “real time”, or as close to it as possible?
Together with our sister company, FoundationMark, we created a solution to estimate foundation assets, and giving rates.
Two Major Stumbling Blocks
We found that there were two main stumbling blocks in tabulating foundation assets. The first hurdle was a consistent way to account for foundations that are not strictly comparable dues to timing difference. The second hurdle was more challenging, how to account for likely changes in asset values between filings.
- Fiscal Year Differences. Foundations can elect any month-end as their fiscal year-end. About 75% of foundations use the calendar year, while the others tend to fall on quarterly periods, March, June, and September. Well known examples of foundations that do not use a December year end include the J. Paul Getty Trust (June), the Carnegie Corporation (September), and the Helmsley Foundation (March).
- Time Lag. Foundations must file their form 990-PF within five months of the close of their fiscal year. Therefor the first source of time lag (the time between close of books and the filing) seems inescapable. The next contributors to stale asset data are filing extensions, foundations are entitled to an automatic 3 month extension, and a further 3 months extension upon request. As one can imagine, larger foundations tend to have more complex accounting, and typically file 10-11 months after the close of their fiscal year. The last source of time lag is that the IRS may take a little time to process before making the information open to public inspection. So data can be a year old or more before it is available.
Different Year Ends
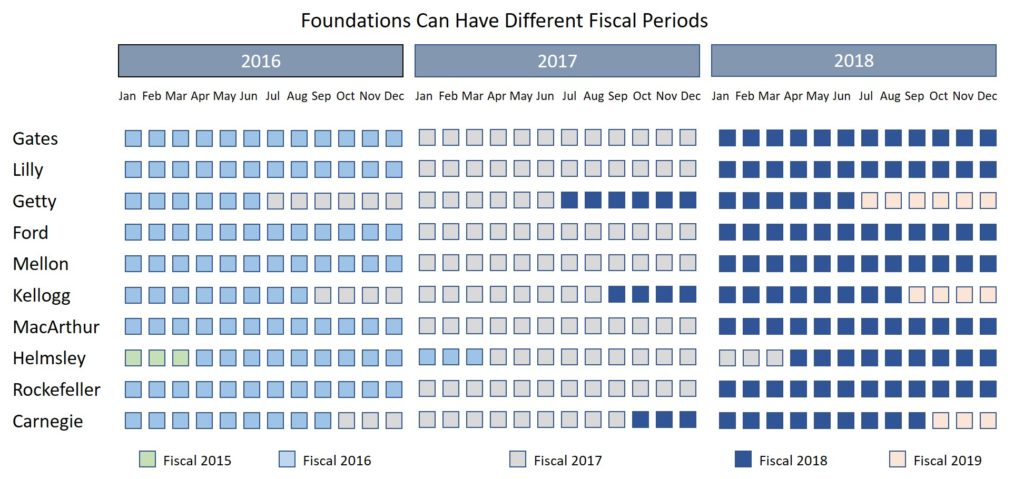
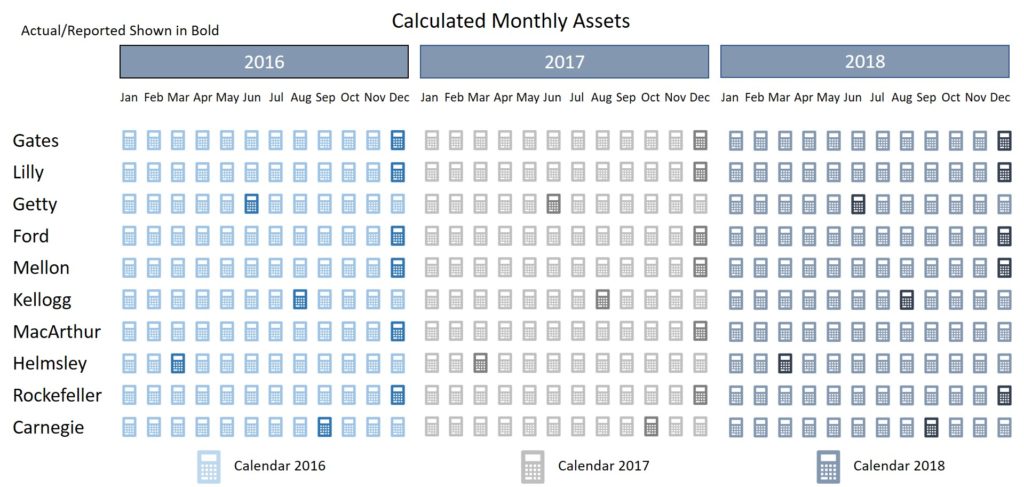
The first hurdle, different year ends, is illustrated in the exhibit below. We chose ten large, well known foundations to demonstrate the issue, which we followed with a graphic depiction of our solution.
As one can see below, four of the ten foundations – Getty, Kellogg, Helmsley, and Carnegie – do not use the calendar year as their fiscal period, choosing June, August, March, and September respectively. FoundationMark designates fiscal year by the larger number of months of covered in the filing period, so the Helmsley Foundation’s year ended March, 2018 is designated fiscal 2017 as it contained 9 months of 2017 and just 3 in calendar 2018. Foundations with June years (6 months in each) are assigned to the same fiscal year as the calendar year, so June 2018 is fiscal 2018.

So why do different fiscal year ends present a problem? Consider the simple question, how much did assets in the 10 foundations in our example rise (or fall) in 2017? Of course it is easy enough to add up the assets for the the six foundations with December 31 year ends, but what about the others? Should one use the June to June increase (or decrease) for Getty? How about Helmsley? March 2016’s value would include data from calendar 2015? In order to measure all foundation assets, one has to establish a protocol for including assets that are not perfectly comparable.
Fortunately this problem has (we believe) a straightforward solution – simply calculate monthly values for each foundation using beginning and ending assets. For example, the Kellogg Foundation’s fiscal year runs from September 1st to August 31st, so FoundationMark calculates an estimated monthly asset level for each month starting with the previous year’s ending asset level, and increasing or decreasing each month until the next fiscal period is reached. It is important to recognize that these calculations represent estimates, but their core purpose is as a source for aggregate data, so variations are unlikely to materially impact any conclusions. With asset values calculated for each foundation for each month, it is now easy to answer the question of much asset values changed in any given year.

Critics may point out that using monthly estimates between filings isn’t a perfect solution, which we acknowledge. However, we maintain that it is the lesser of two evils as the only other option is using asset levels from different dates. We believe that estimates improve accuracy when calculating aggregate data, whose primary use is understanding year to year asset changes. (It bears reiterating that 75% of foundations have December year ends so any objection to using calculated values should be confined to the 25% that choose different year ends in the case of yearly trends). For foundations who’s assets change a lot over the course of a year, either due to a large incoming contributions, high level of grants, or significant investment gains (or losses), we maintain that estimates improve over accuracy as they account for magnitude and direction of change.
Time Lag
The other hurdle in getting a clearer “real time” picture of assets is the time lag between foundations’ last reported value and the current period, which as we pointed out above can stretch out over a year. In order to estimate asset levels, one has to make three important assumptions, the first two relate to cash flow – money coming in to foundations and money going out in grants and expenses. For these two items, we rely on historical patterns. Over the past decade, incoming contributions ranged between 3 and 6 percent, with some correlation to stock market performance (in years of strong market performance, foundations received more incoming We rely on the GIV performance index to estimate the investment returns across the foundatnlike estimating intra-period asset levels (the method above) using beginning asset level, incoming contributions, outgoing grants and expenses, and ending assets – The technique is best illustrated with an example. Let’s it reaAlthough foundations are required to report the fair market value of their assets (along with other important financial disclosures) in an annual filings, there are two major stumbling blocks to having current data.