Measuring Giving in Dollars and as a Percent of Assets
Examining foundation giving is best approached from two perspectives, first, in terms of actual dollars distributed by foundations each year, and secondly as a percentage of assets. Below we provide answers to both. In doing so, we hope to demonstrate the relationship between asset levels and giving, as well as provide some insight as to what to expect for future giving.
A good place to start is with a historical overview; the chart below shows a 25 year history of foundation giving (grants plus operating expenses).
Note: The data in the chart below is from Giving USA, all other data is provided by our affiliate, FoundationMark.
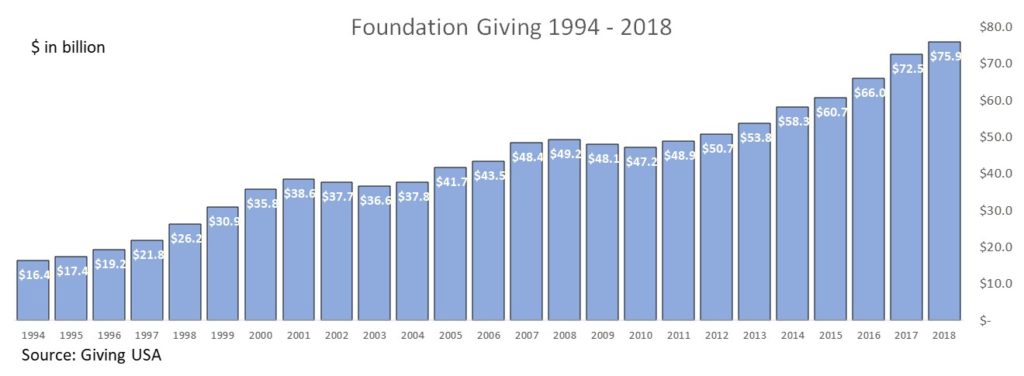
As one can see in the chart above, in 2018 foundations provided about $76 billion in philanthropic support. Giving has grown substantially over the period, rising from $16.4 billion in 1994 to $76 billion in 2018, the most recently reported year available from Giving USA, reflecting an annual growth rate of 6.6%.
At first glance, one might only clock the steady upward trajectory of giving growth and dismiss two distinct periods when giving not only didn’t grow, it contracted. Upon closer inspection one can see that the down periods coincided with significant drops in financial markets. In the wake of the dot-com stock market bubble of 2000, giving fell from 2001 to 2003. Similarly following the financial crisis of 2008, giving dropped in 2009 and 2010.
As Assets Go, So Goes Giving
Downturns make it easier to spot the relationship between giving levels and financial market performance, but the same correlation between financial markets and giving holds true in good times. Just as financial markets soared ahead of the 2000 crash, so too did giving experience rapid increases, and the same can be seen following the financial crisis as giving levels increased by over 50% from 2010 to 2018 alongside market gains
It shouldn’t come as a great surprise that foundations’ giving levels are tied to their asset levels, after all the minimum amount that foundations are required to pay out is calculated using a percentage of assets. But we wanted to understand more about the relationship between assets and giving.
Statistically Speaking
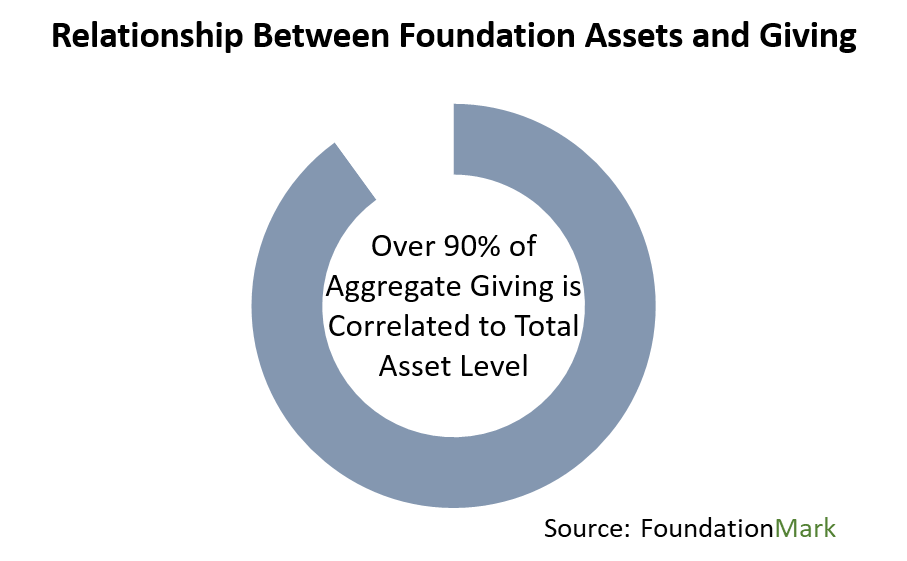
Merely observing that giving fell in times of financial market stress and increased when asset levels grew might strike one as an unscientific approach, and we agree. Therefor we turned to statistics to determine the relationship. Using correlation and regression analyses, over the period from 2007 to 2018, over 90% of giving rates were explained by asset levels (more on this topic below).
Five Percent of Assets, a Floor Not a Ceiling
Having determined that assets and giving are closely aligned, the next step was to explore how much of their assets foundation pay out per year. Most people involved with philanthropy are familiar with the tax regulation requiring foundations to distribute at least five percent of their assets annually in grants and operating expenses or risk substantial penalties. Consequently, many people take it for granted that foundations steer pretty closely to that five percent ratio, skipping over the fact that five percent is the minimum rate, not a prescribed amount. Foundations are free to pay out more if they choose.
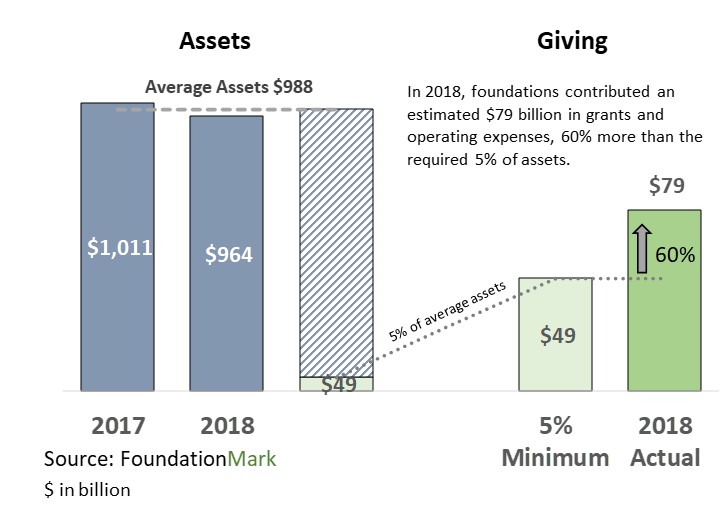
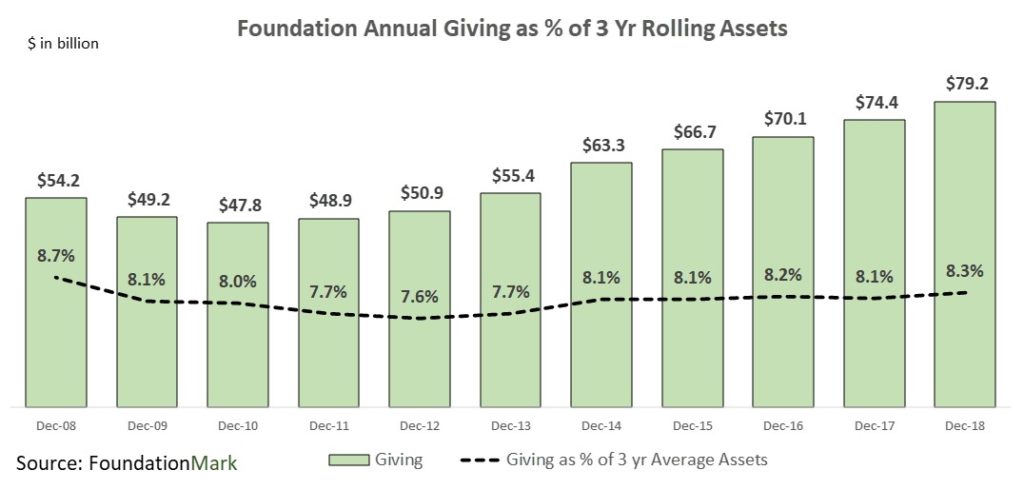
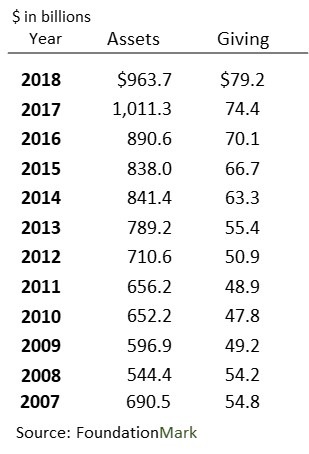
As shown in the chart, foundations assets in 2018 averaged a bit less than $1 trillion. Therefor, it follows that if foundation grants and expenses were limited to the five percent minimum, they would have paid out a bit under $50 billion. But, as we can see, giving was nearly $80 billion for the year, representing about 8% of average assets.
If It's Not Five Percent, What is the Payout Rate? How Should One Calculate it?
As we saw above, in 2018 foundations distributed much more than the five percent minimum, but was that an anomaly? How much have foundations been giving in previous years? How should we measure the payout ratio to best understand giving rates?
Like any ratio calculation, the payout rate is heavily influenced by the choice of denominator, in this case asset levels. Therefor we looked at four different ways to calculate a ratio using 1) ending assets, 2) beginning assets, 3) average assets, and 4) three year average assets as the denominator in an effort to find the best fit (highest coefficient of determination).

*Payout Ratio Asset Options
- Giving as a percent of ending assets.
- Giving as a percent of beginning assets.
- Giving as a percent of average assets.
- Giving as a percent of 3-year average assets.
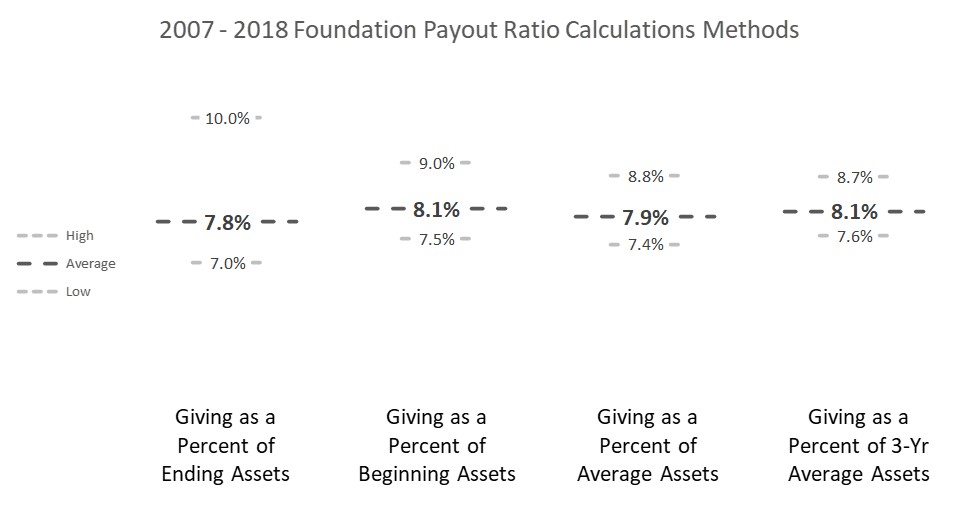
As one can see from the chart below, all four methods returned similar average payout ratios of about eight percent. It also bears noting, that the lowest single year payout ratio by any asset denominator was 7.0% (ending assets in 2013), which was still far higher than the five percent minimum.
Interestingly, one can also see that the High/Low ranges fall as one moves from left to right, with ‘ending asset’ having the largest range of 3.0% (10.0% – 7.0%), while the ‘3-year average’ showed a much narrower spread at just 1.1% (8.7% – 7.6%). Another way to look at the data is that in every year in the 12 year period covered, the payout rate was between 7.6% and 8.7% of ‘3-year average’ assets.
How to Read the Data
The top number in the chart is the highest annual payout rate for the period 2007 – 2018, followed by the average, and lowest based on the four asset denominator options. The smaller the difference between high and low, the more consistent the payout ratio.
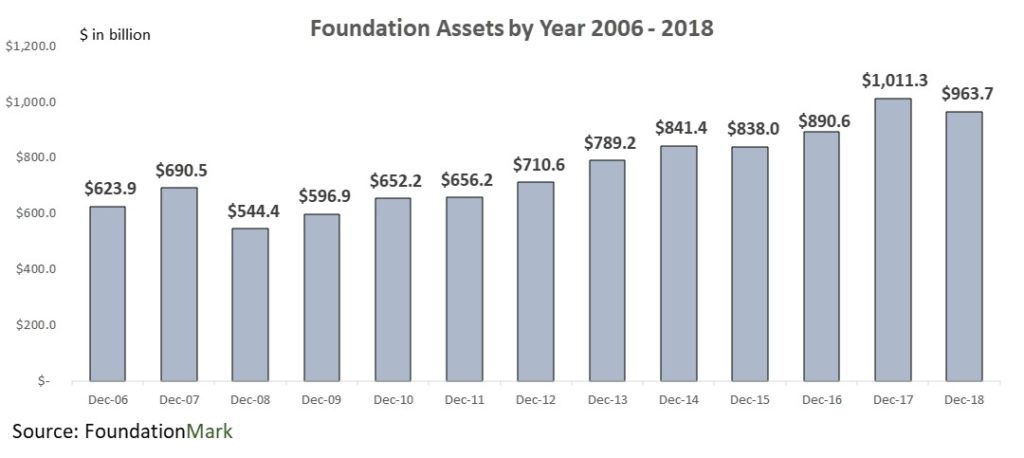
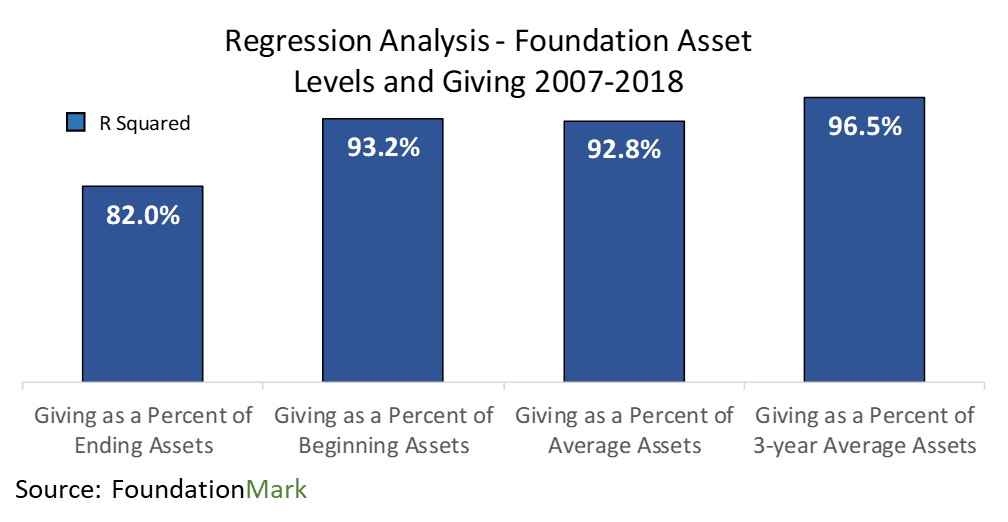
Ironically, the most intuitive choice of denominator for calculating payout ratios, ‘ending assets’, provides the lowest correlation of the four denominator choices described above. For example, the year 2008 in the table when giving was $54.2 billion, which once divided by ending assets of $544.4 billion, yields a 10.0% payout ratio for the year, which is a clear outlier in the exhibit. The regression chart below shows the relative levels of correlation among the four asset level choices.
As we noted above, the ‘3-year average’ asset denominator had the narrowest spread between high and low, it also ranked highest in regression analysis.
Regression Analysis
Regression analysis essentially measures how changes in one set of numbers (assets) influence a second / dependent factor (giving). Performing a regression analysis on two sets of variables provides a measurement called R Squared, or the coefficient of determination, which describes how closely one affects the other.
Returning to the Original Question - A Framework for Understanding Giving
We started this note by asking the seemingly simple question about foundation giving, and we hope we not only answered the question but also provided some insights into giving’s relationship to asset levels and payout rates. In short, we believe that a single number isn’t enough and that foundation giving is better understood as a function of two variables:
Giving = Assets x Payout Ratio
Further, it is fair to say that over the past decade the core equation above could be refined to:
Giving = 3-year Average Assets x 8%
Reasons to View Giving Levels as an Equation
The purpose of describing giving as a formula is 1) to have a framework for understanding what drives giving, and 2) to provide a method for estimating giving in recent periods. Looking at all the data and figures in this note, one might be struck by the fact that we used 2018 as the end period for all the analysis. Why not 2019? One of the stumbling blocks that accompanies any discussion of foundations’ financial positions is the time lag between activity and reporting. Foundations are required to submit financial statements to the IRS within five months of the close of their fiscal year, but most of the larger foundations get extensions resulting in data that can be a year or more dated. Consequently, if one wants to estimate giving levels for more recent periods, the formula above makes a reliable baseline.
Of course foundations can opt to payout more (or less) of their assets in any year, and may respond to the COVID pandemic by increasing giving. Having tools and a framework in place to measure giving rates allows for deeper understanding and better analysis of philanthropic support.
Appendices
Gates Foundation Impact on Aggregate Disbursement
As the biggest foundation by far, the Gates Foundation’s decisions are large enough to impact the market as a whole. Gates historically pays out a whopping 12-13% of its 3 year average assets. Excluding the Gates foundation from the disbursement calculations, would lower the foundation payout rate about 30 basis point to around 7.8%.
Further Reading
“In the United States cohort, the expenditure rate is 9 percent.”
Global Philanthropy Report: Perspectives on the Global Foundation Sector
Harvard Kennedy School Center for Public Leadership, 2018
“The private foundations in our 2012 report gave significantly more than they were required by law to give.”
Think You Know Private Foundations? Think Again.
Stanford Social Innovation Review January 2, 2014