Mandated Five Percent is a Floor Not a Ceiling
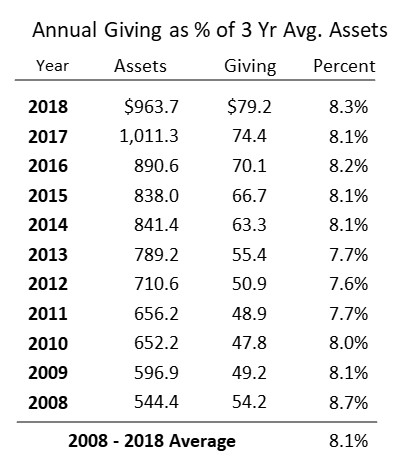
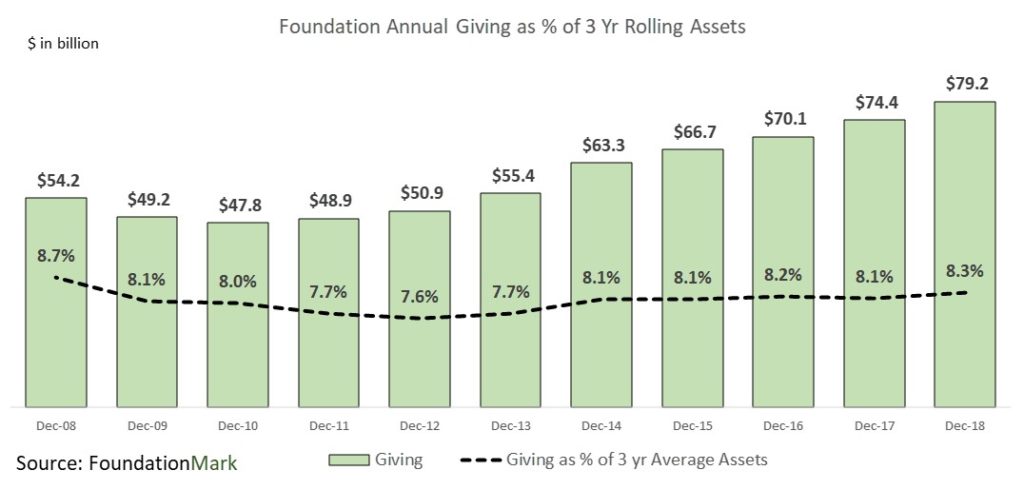
Most people in the philanthropic world are familiar with the 5% payout requirement that nonprofits must observe to maintain their tax exempt status. Therefor, it’s quite natural to assume that foundations take the 5% rate as scripture and rarely deviate from it. The filings of some of the largest foundations – Ford, Lilly, MacArthur to name a few – show that they steer close to 5%, which would seem to confirm the prescribed rate as the industry standard. Most foundation observers would allow that a few foundations, notably Gates, which puts out about 12% of assets each year, might skew the numbers upward, but a 5% payout rate should be about right. For many, this might have been the end of the discussion, however, looking at the the numbers tells a different story. While it is true that most foundations stick close to 5%, in aggregate, they pay out a far higher proportion of their assets. In fact, foundations have averaged a little over 8% of their 3 year average assets over the past decade, including throughout the financial crisis of 2008
At first glance, it may seem contradictory both to say that most foundations pay out 5%, and foundations overall pay out 8% of 3 year average assets, so how does one reconcile the difference?
Conventional Wisdom - Five Percent of Assets
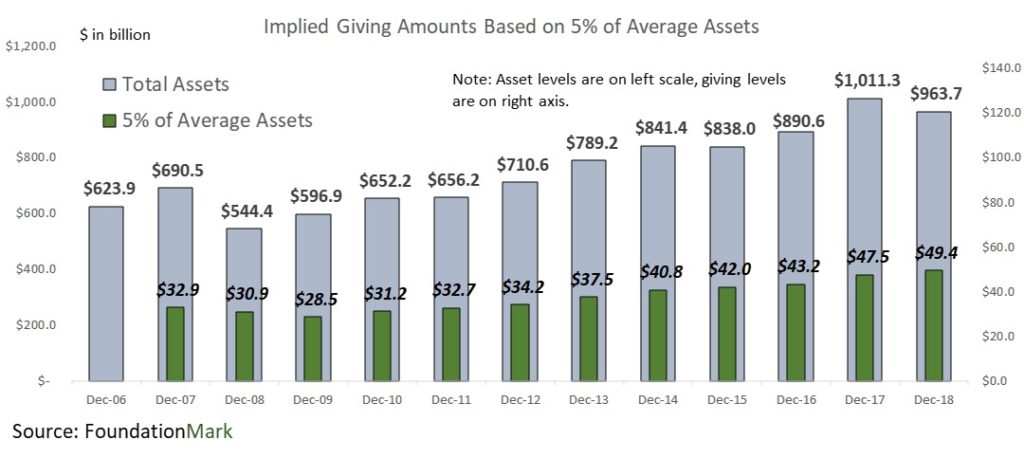
The chart below illustrates the hypothetical amount of giving foundations would have made if they paid out 5% of average assets (beginning of year and end of year). In isolation, the chart seems to make intuitive sense. One can see the effects of the financial crisis in 2008-2010, and the subsequent recovery as markets (and giving alongside it) increased over the following years.
Adding Context
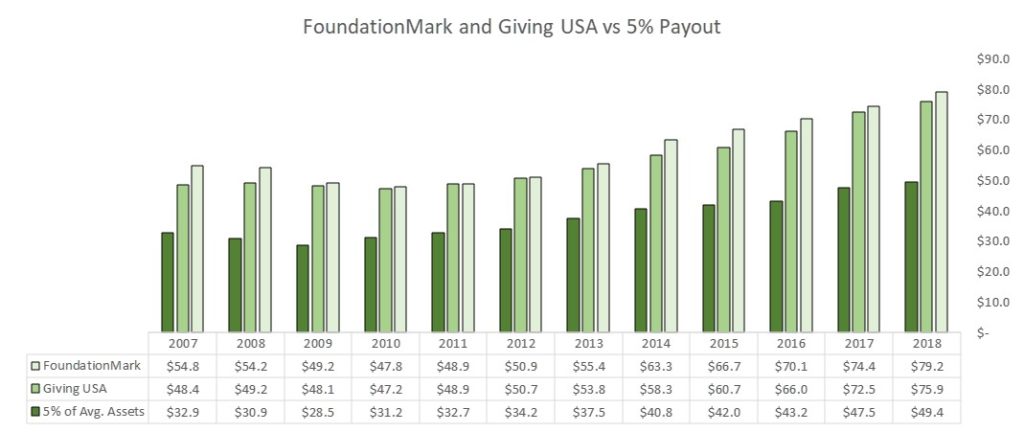
But, when we tried to reconcile the 5% rate with other data sources, there was a large and consistent difference. As seen in the chart below, Giving USA, which tracks philanthropic support nationally, and FoundationMark which sources data from over 45,000 foundations from the bottom up, found that giving was substantially more than 5%. In fact, Giving USA and FoundationMark, both reported giving about 50% higher than the 5% mandate.
Average Assets or 3 Year Average Assets
- After establishing the fact that foundations payout far more than the required 5% of assets, we set about looking for the relationship between assets and giving that had the highest correlation. After all, calculating a ratio is pretty straightforward proposition, requiring only a numerator and denominator. In the case of measuring disbursement rates, the numerator is easy – it is simply the total amount of giving for the the year, but what about the denominator? We took three approaches to getting the best fit.
- Giving divided by ending assets.
- The simplest approach would be to merely divide the amount of grants and operating expenses by reported assets at year end. While this technique might seem like the intuitive solution, it has several flaws, the first of which is that the most recently reported assets reflect the asset value after grants and expenses have been paid.
- Giving divided by average assets.
- An improved approach considers the average asset levels throughout the year as the denominator. After all, foundations are asked to provide their average monthly asset values as a part of the calculation to prove that they are in compliance with the 5% rule (there is more to the 5% calculation than that, but that is outside the scope of this note). Using average assets greatly narrows the difference in disbursement rates from year to year.
- Giving divided by average three year assets.
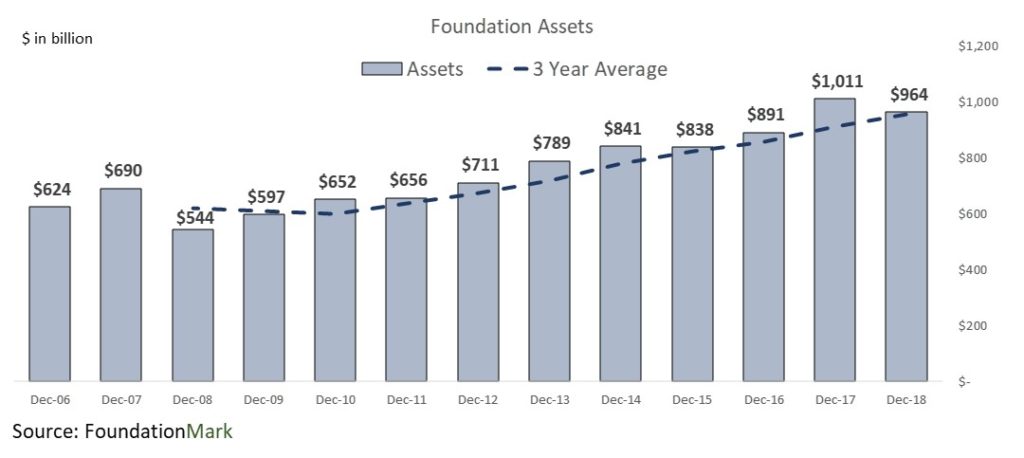
- Rather than stopping at a simple average, we looked at other time periods and found that a rolling 3 year average of assets as the denominator showed the lowest variance in disbursement rates from year to year. Our findings are consistent with the policy that many of the largest (and thus biggest grantmakers) use 3 year average assets in budgeting their grants to avoid large swings in funding charitable operations.
Understanding Giving Rates
Payout rates can vary across foundations for example some foundations receive significant incoming contributions which they may pay out in the same year, resulting in payout rates up to and over 100%. Similarly, other foundations might be winding down and would have high payout ratios as well. On the other hand, new foundations may take a few years to ramp up giving and report very low payout rates. The point, however, is that in aggregate, the total giving rate gas been very consistent at just over 8% on 3 year average assets, significantly higher than the 5% mandate.
This information can be useful fore forecasting foundation giving and the associated budgeting for operating nonprofits.