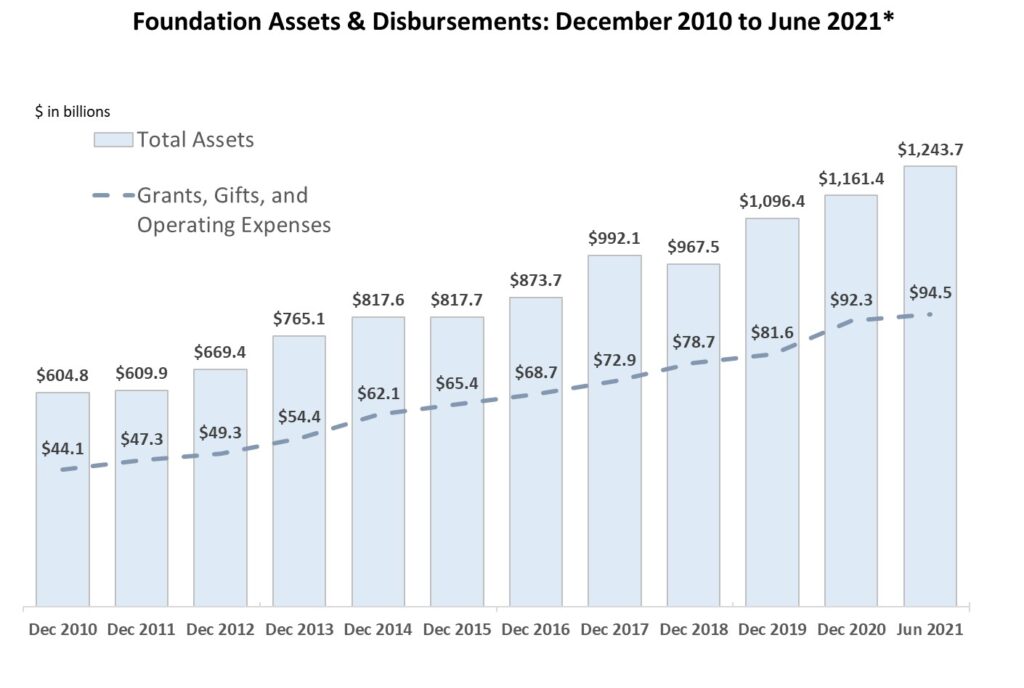
FoundationMark models indicate that U.S. foundations’ assets rose to $1.24 trillion as of June 30, 2021. The recent growth in foundation assets is primarily attributable to investment gains of 9.3% for the GIV Index in the six months to June 30, 2021. Since the pandemic low in March 2020, global equity markets have delivered strong returns, fueling foundation asset and giving growth.
Over the longer term, foundation assets have doubled from $605 billion to the current $1.24 trillion level since December 2010. Disbursement growth has kept pace, more than doubling from $44 billion to the current expected annual rate of $95 billion for 2021. In aggregate, foundations have paid out about $550 billion in grants and charitable support in the 10 year period from 2010-2020.
Completing the Picture
While asset levels and and charitable support growth get the most attention, there are two other important numbers at work that are often overlooked, but necessary to complete the picture – incoming contributions and investment performance.
In the decade to December 2020, foundations received nearly $500 billion in incoming contributions, and in any given year, about 40% of foundations report receiving contributions. One way to look at this is that money has been flowing into foundations almost as quickly as it has been flowing out. About 83% of aggregate outflows are covered by aggregate inflows – $500 billion of cash inflows divided by the roughly $600 billion of cash outflow ($550 billion in charitable support plus about $50 billion in investment and non-charitable expenses over the ten year period). Over the decade there have been a lot of very large gifts and many new foundations established that contributed to this eye-popping $500 billion inflow.
The other big factor in the asset growth over the decade has been investment performance. Using the numbers above, a “back of the envelope” calculation shows an investment gain of over $700 billion from a base of $605 billion, or more than doubling in 10 and a half years. (Start with $605 billion in assets, add $500 billion in incoming contributions, subtract $600 billion in grants and expense, gets to $505 billion versus $1.24 trillion of current assets, so about $700 billion of investment gains.) At first glance, a 100% return over that time frame might seem impressive, however, over the same period, the S&P 500 gained over 300%, a mix of 60% stocks and 40% high grade bonds returned 180%.
*The data in the chart above combines historic information drawn from foundations’ reported asset levels and disbursements obtained from their annual tax filings, along with projected values based on the FoundationMark Grantmaker Investment Value (“GIV”) Index which estimates monthly returns for the foundation universe based on reported asset allocations and market returns. Gifts, grants, and operating expenses projections are based on historic disbursement ranges.