News and Analysis of Foundation Investment Performance
First Quarter Investment Performance
By
GIV Index Starts the Year on a Positive Note
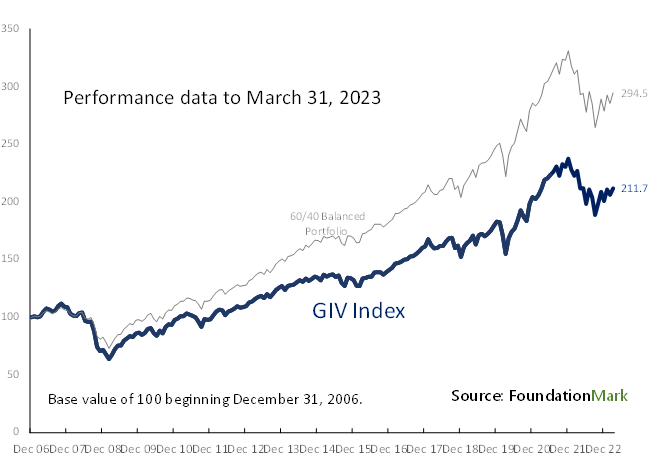
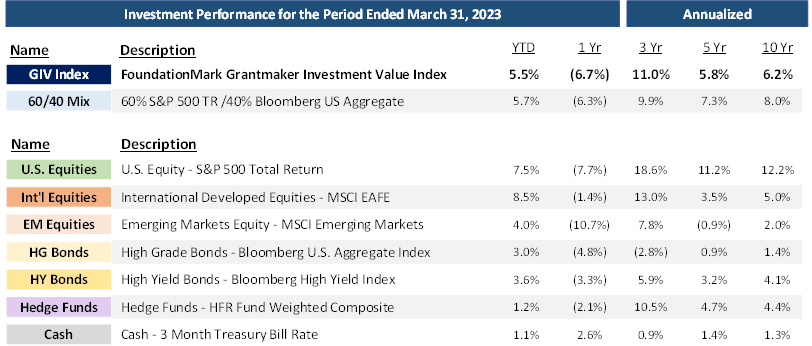
The Grantmaker Investment Value Index (“GIV”) rose 5.5% in the first quarter, following a good fourth quarter in 2022, but still well off the highs of December 2021. Over the longer term, foundation investment performance annualized at 6.2% per year for the ten years ended March 31, 2023, trailing the 60/40 mix (the traditional mix of 60% S&P 500 and 40% Bloomberg Aggregate Index) by 180 basis point per year, or about 40% over the decade.
Returns in the first quarter for foundations were driven by strong equity markets across the globe with U.S. stocks up 7.5% in the quarter, trailing only international developed markets that were up 8.5%. Bonds also fared much better at the start of 2023, posting gains of 3% after a terrible 2022 when the fixed income market fell 13%.
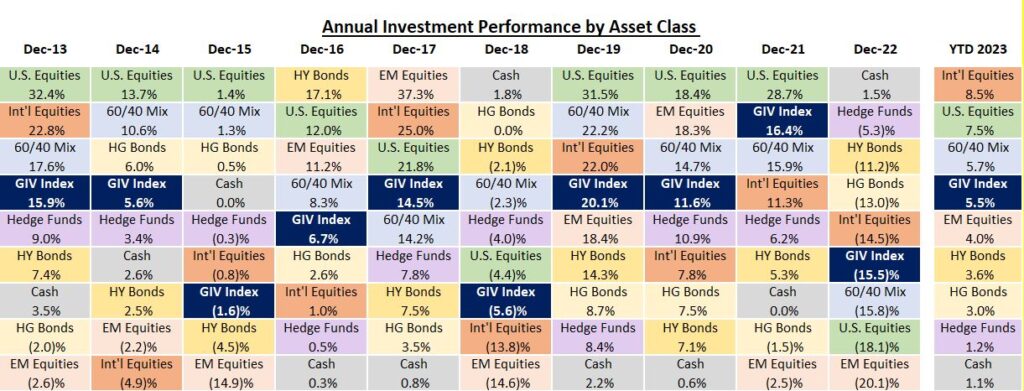
Asset Class Returns
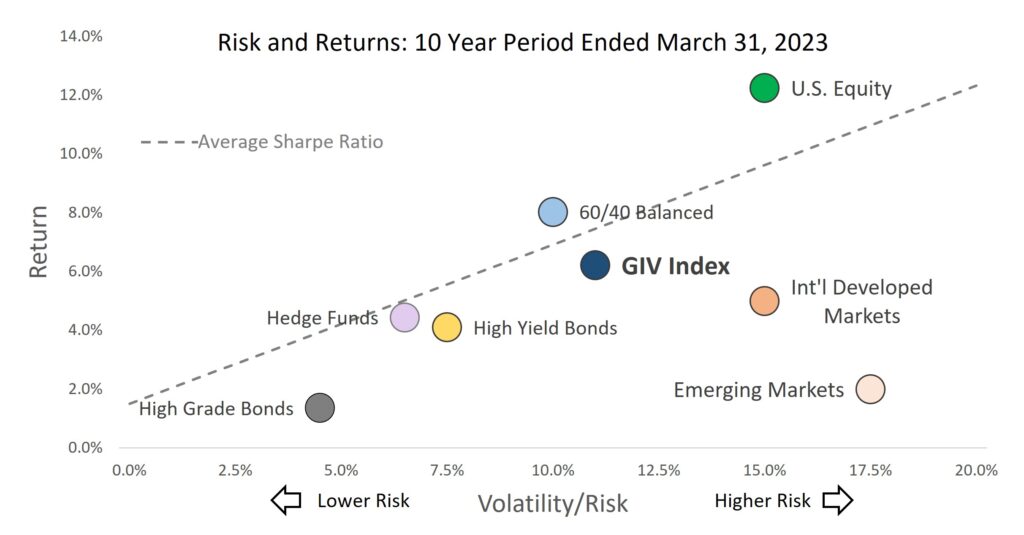
Risk and Return
The chart below shows the relationship between risk and return. In the chart risk is defined as volatility (shown on the x-axis) and return is plotted on the y-axis. Asset classes out to the right (International and Emerging Markets) are more volatile then those closer to the axis (High Grade Bonds). As one can see, over the 10-year period, U.S. Equities were the strongest performer, up 12.2% (y-axis). The dotted line shows an approximation of the average Sharpe ratio which is a measure of risk weighted return. Asset classes above the line delivered better risk/return than those below. U.S. Equity was the lone outlier over the period (which also drove the 60/40), with Hedge Funds a solid second place.
As one can see Emerging markets were a poor asset allocation choice for the decade, with annualized returns of just 2% and volatility greater than U.S. Equity markets. Another way to look at it is that Emerging Markets delivered essentially the same return as High Grade Bonds, but with much greater risk.
The FoundationMark GIV Index is calculated using FoundationMark return estimates up to and including June 30, 2021 thereafter monthly returns are estimated based on reported asset allocations and market returns. The GIV Index serves as a proxy for foundation performance. Actual performance may differ materially. The GIV Index is updated on a continuing basis and all data is subject to revision.
The 60/40 Balanced Portfolio represents the traditional institutional allocation to equities and fixed income with weightings of 60% in the S&P 500 and 40% in the Bloomberg U.S. Aggregate Index, rebalanced monthly.