Footer
Are you a trustee?
Interested in a free FoundationMark report on your foundation’s investment performance? click here
Contact Details
E-Mail: info@FoundationAdvocate.com
By
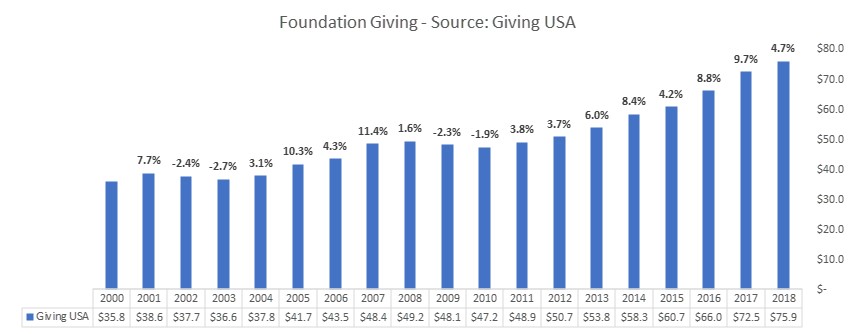
Giving USA provides the results of annual surveys (below) which show the historical perspective on foundation giving. One can see that giving is fairly constant, even throughout the financial crisis of 2008, giving fell about 5% from 2007 levels to 2011 before a strong upward trend through 2018, the last survey results which are typically published in early summer.

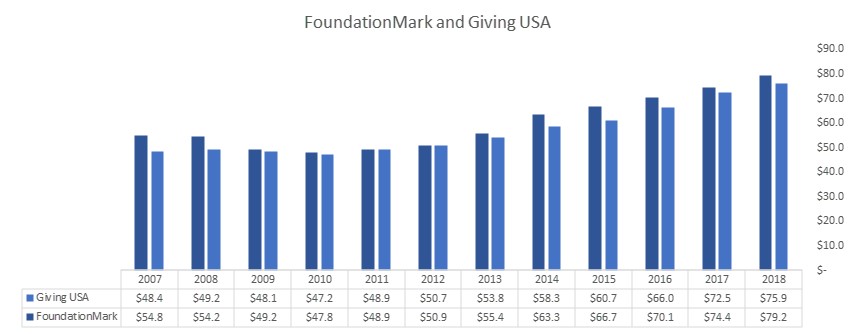
FoundationMark (our affiliate) also tracks foundations giving using public filings rather than surveys, and naturally they the historic data is extremely similar for the same periods covered, although the FoundationMark data reveals more volatility, with giving falling farther from 2007 through 2010 and rebounding more sharply since 2013.

There is an inherent relationship between foundation asset levels and foundation giving. Many assume that foundations distribute the mandated 5% of assets each year, but as the data shows in the charts above, giving levels are more stable than asset levels. Consider the fact that the S&P fell 40% in 2008, and foundation assets tumbled about 23%, yet giving dropped much less violently. The converse is also true, over the past decade, the stock market (and by extension foundation assets) has posted gains of over 15% in some years while giving has grown but at a slower pace.
Many of the largest foundations use a 3 year rolling average of assets to determine their annual grantmaking. This results in a more consistent level and keeps operating charities from being whipsawed in funding levels from year to year. Over the past 5 years foundation have disbursed between 8.0 – 8.5% of the trailing 3 year average assets in grants and operating expenses.

Using the GIV performance estimates to forecast asset levels and an 8% payout ratio, FoundationMark believes that 2019 giving was up 6.1% to $84 billion.
Applying the same logic to the current marketplace, the global stock sell off has led the estimated value of foundation assets to fall about 15% through March 16th, 2020, with a corresponding expected giving drop of nearly 6% versus 2019.
Again, the 2020 estimates are based on the estimated current value as of March 17th, 2020. This valuation has been subject to extreme volatility recently and any additional material changes (plus or minus 5% or more in the S&P 500) will change the forecast materially.
Interested in a free FoundationMark report on your foundation’s investment performance? click here
E-Mail: info@FoundationAdvocate.com