Charts, Graphs & Maps
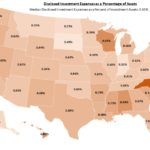
Disclosed Investment Expenses as a Percent of Assets by State
North Carolina and Wisconsin reported the highest disclosed investment expenses, while the Dakotas and Indiana reported the lowest. … [Read more...] about Disclosed Investment Expenses as a Percent of Assets by State
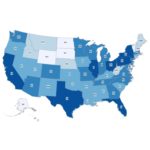
5 Yr Performance by State
Maine and Vermont Lead the Pack As the map and table below shows, Maine and Vermont led all sates, while North Carolina and North Dakota trailed. It bears noting that North Carolina foundations reported the highest disclosed investment expenses. … [Read more...] about 5 Yr Performance by State
1-Yr Performance by State
New England Leads the Pack Investment performance data provided by FoundationMark. As the chart above and table below show, 4 of the the top 5 performing states in for the year ended December 2017 were in New England - Rhode Island, Maine, Vermont, and Connecticut, with Pennsylvania rounding out the top 5. Foundations in Idaho, Louisiana, and Mississippi had the lowest … [Read more...] about 1-Yr Performance by State

