News and Analysis of Foundation Investment Performance
Bird’s Eye View: Pennsylvania
By
Every month, FoundationAdvocate (“FA”) highlights a state by providing a brief overview of its foundations in terms of performance, fees, and asset allocation. Data on Pennsylvania foundations and other states can also be found at Top Ten. The opinions expressed are FA’s.
Pennsylvania Highlights
Better Median Investment Performance Versus Overall Foundation Market
Lower Investment Expenses Than The National Average
Most Popular Portfolio Strategy: Investments – Other
Least Popular Portfolio Strategy: Capital Preservation
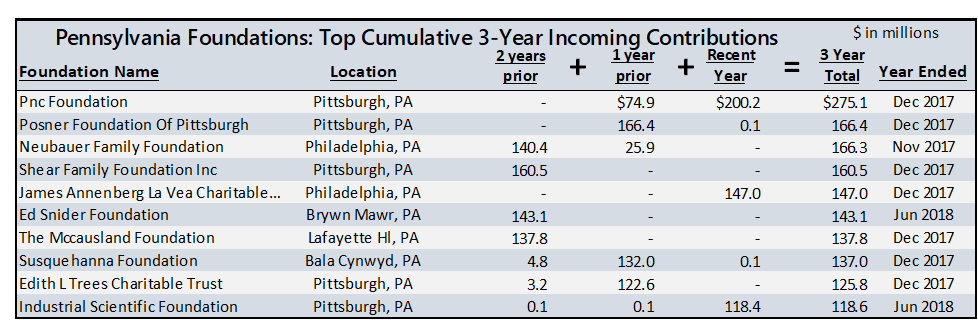
Biggest Incoming Contributions (3-year)
PNC Foundation
Posner Foundation
Neubauer Family Foundation
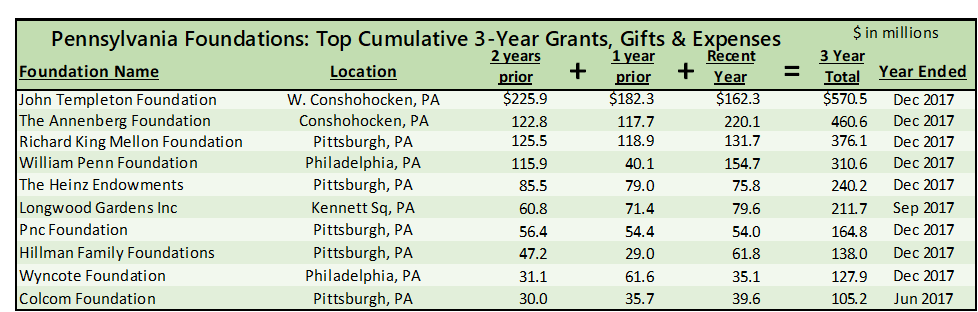
Biggest Grantmakers (3-year)
John Templeton Foundation
The Annenberg Foundation
Richard King Mellon Foundation
Overview
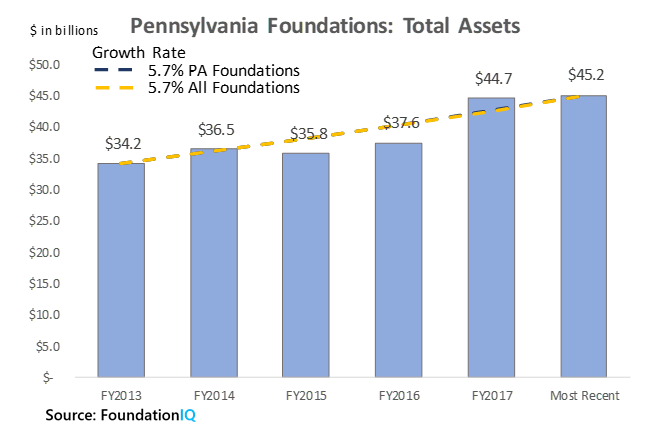
Pennsylvania foundations’ total asset growth of 5.7% per year since 2013 has been the prime driver behind a 5.2% per year increase in grants, gifts, and operating expenses paid over that same time frame.
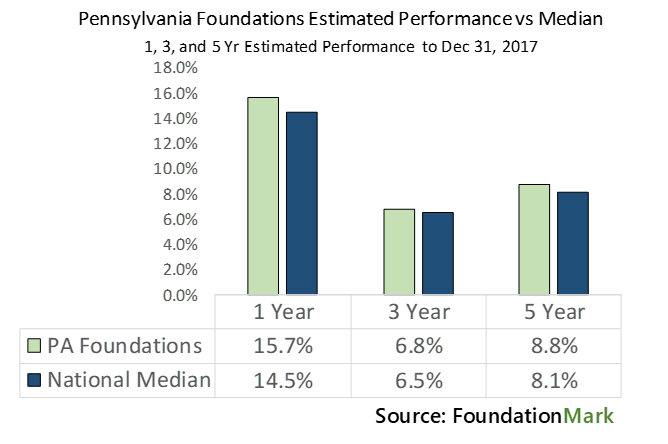
Pennsylvania foundations were among the best performers in the country in terms of investment performance for the 5-yr period ended December 31, 2017 (a 2018 update will be issued in the next several months), with 5-yr annualized returns of 8.8% versus the 8.1% national average for this period.
All data used in rankings and calculations is provided by FoundationMark and FoundationIQ and reflects foundations with over $1 million in assets.
Asset Growth: The Key Metric Driving Philanthropic Support
The big picture is pretty straightforward, since foundations are required to pay out at least 5% of their assets each year (the actual average overall payout rate has been over 7% of average assets in the last several years). In order to maintain, or hopefully, increase support, foundations need to grow their assets faster then they are spending.
Therefor, there are a few key financial metrics that affect asset levels to keep an eye on.
Money coming in: Incoming contributions.
Money going out: Gifts, grants, and expenses.
Investment earning returns: Income and appreciation generated by investments.
To a certain degree, money going out is set at a prescribed rate, incoming contributions can be unpredictable at best, which is why FoundationAdvocate focuses on the third metric, investment performance – which drives asset growth, and by extension, philanthropic support.
FA’s Bird’s Eye View provides readers with a big picture look at foundation investment performance at the state level using FoundationMark performance estimates, portfolio strategy classification, and star ratings. We believe that seeing foundations from an investment perspective will lead to better informed investment decisions which in turn may lead to improved performance.
Note: Unlike operating nonprofits such as schools and hospitals, private foundations typically have no outside revenue sources.Incom
Pennsylvania's 5-year Asset Development
As shown in the chart above, Pennsylvania foundations’ assets have increased by $11 billion from $34.2 billion to $45.2 billion since 2013.
Pennsylvania foundations (blue hashed line) growth annualized at a 5.7% per year rate, in-line with the overall foundation U.S. foundation growth rate (yellow hashed line) of 5.7% per year.
As one can see from the chart above, Pennsylvania’s assets increased a significant amount between fiscal year 2016 and fiscal year 2017. Disbursements (especially among larger foundations) are often made using several years’ trailing average assets, so gifts, grants and operating expenses growth may lag asset growth.
Pennsylvania’s asset growth was more than sufficient to support overall grant, gifts, and operating expense (see details at bottom) growth of 5.2% per year since 2013.
Pennsylvania's Overall Ranking among States
Pennsylvania foundations reported total assets of $42.5 billion, placing fifth in overall assets among states.
Pennsylvania foundations’ 5-year total-asset growth rate of 5.7% ranked 21st among states over this time period.
Pennsylvania foundations’ median 5-year annualized rate of return for the period ending December 31, 2017, was 8.8%, the 7th highest among the states.
Investment Performance
As shown in the chart above, Pennsylvania foundations’ estimated median performances for the 1-year, 3-year, and 5-year periods ending Dec 31, 2017, were 15.7%, 6.8%, and 8.8%, respectively.
For the five year period, according to FoundationMark’s estimates Pennsylvania foundations outperformed the overall U.S. foundation universe by 72 basis points per year.
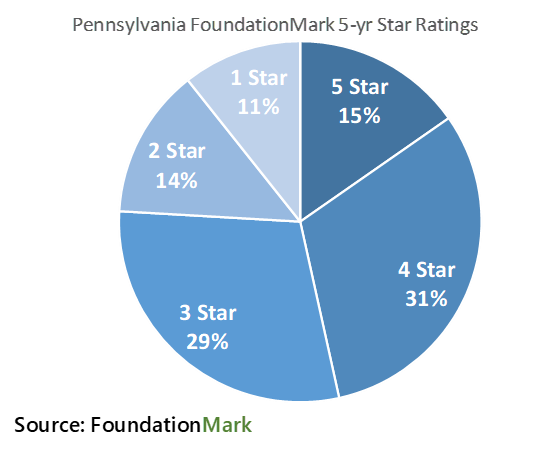
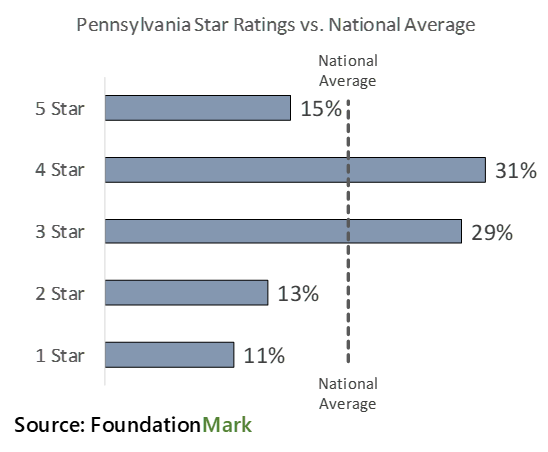
FoundationMark Star Ratings
FoundationMark ranks foundations according to their estimated investment returns, foundations that place in the top 20% are rated 5 Stars, the next 20%, 4 Stars, and so on. As seen in the charts below, 15% of Pennsylvania foundations qualified for a 5 Star rating in the 5-yr period to December 31, 2017, lower than the national average of 20%, but when combined with the 31% with 4 Star ratings, brings the total to 46% in the outperforming groups. Only 24% of Pennsylvania foundations were in the lower performing 1 and 2 Star groups, versus 40% for the overall U.S. market. The average rating of 3.27 Stars exceeded the national average at 3.00.
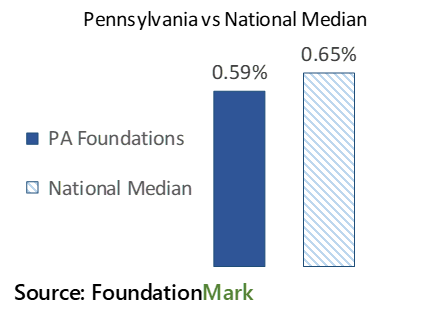
As shown in the chart, “Pennsylvania vs National Median”, the investment expenses for Pennsylvania foundations of 59 basis points were 6 basis points lower than the national median of 65 basis points.
Note: FoundationMark performance are net of disclosed investment expenses, therefor fees have a direct impact on performance estimates.
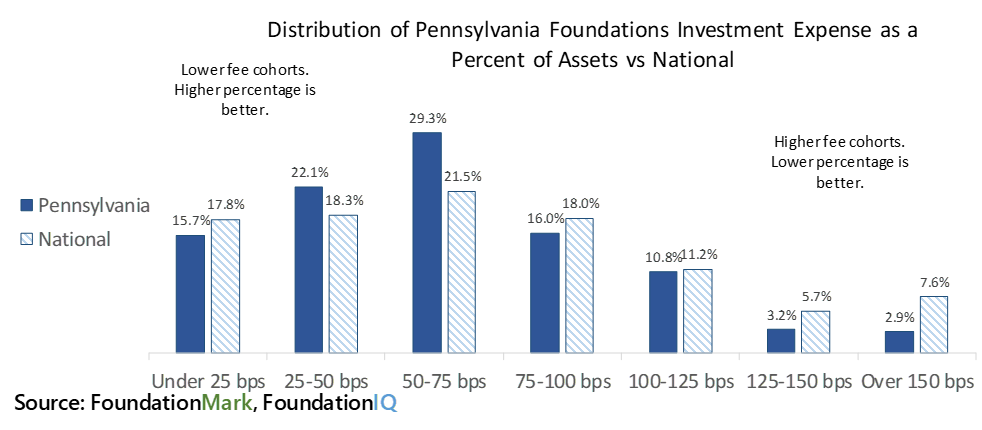
The chart below compares the percentage of Pennsylvania foundations by fee cohort with national percentiles.
In their most recently reported year, Pennsylvania foundations had higher percentages in the lower fee columns (those to the left) and a lower percentage in the higher fee columns (those on the right) compared to national averages.
FoundationMark Portfolio Strategy Description
Asset allocation, and thus portfolio strategy, is typically a major determinant of investment performance, for example, foundations with a high exposure to equity markets (Capital Appreciation) are likely to have performance with a high correlation to equity markets.
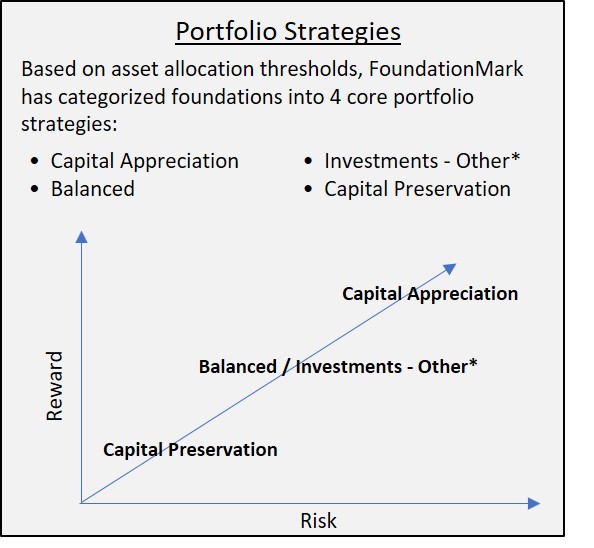
The chart “Portfolio Strategies” graphically represents the inherent relationship between risk and reward as it pertains to investment strategies, where increased reward of an investment, i.e., its return, is accompanied by increased risk, i.e., volatility or risk of loss of principal. The level of investment risk in a portfolio can be hard to measure, especially without position level granularity, therefor FoundationMark groups portfolios into four categories explained below based on overall asset allocation in terms of risk (on the horizontal axis) and reward (on the vertical axis).
In summary, the four FoundationMark strategies are defined as follows:
Capital Preservation – This strategy is characterized by a comparatively high allocation to lower risk/lower returning assets such as cash, government, and corporate bonds. Foundations with more than 40% of their assets in cash and fixed income fall into this strategy.
Capital Appreciation – Foundations that allocate a relatively high proportion of assets, 85% of total assets or more, to higher risk/higher returning equity markets are classified as Capital Appreciation.
Investments – Other* – This strategy bears the name of a line item on the tax form balance sheet, under which hedge funds, private equity, real estate, and other investments are included. If a foundation has over 60% of its assets in Investments -Other, it is placed in this category.
Balanced – As the name suggests, a Balanced strategy represents a more even distribution across asset classes with significant representation of both equity/investments – other and cash/fixed income. The thresholds for Balanced portfolios are 15-40% in cash and fixed income and 60-85% in equities and investments – other.
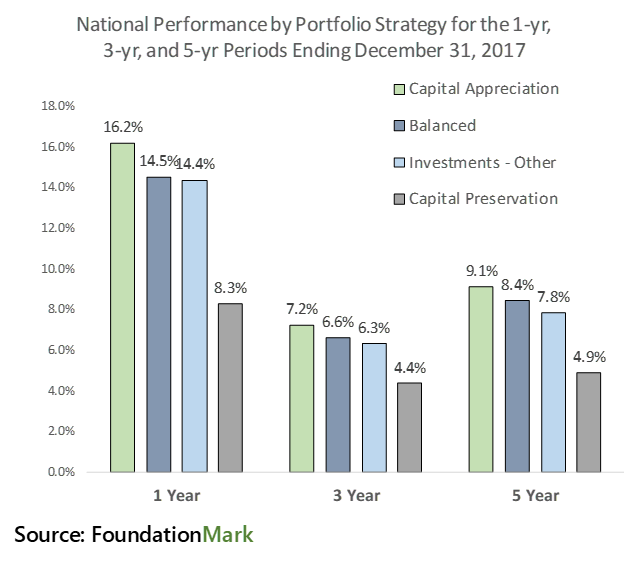
Strong global stock market performance over the five year period to December 31, 2017 propelled Capital Appreciation foundations to 9.1% average annual returns, while those with Capital Preservation portfolio allocations averaged just 4.9% per year. Balanced portfolios outperformed Investment – Others.
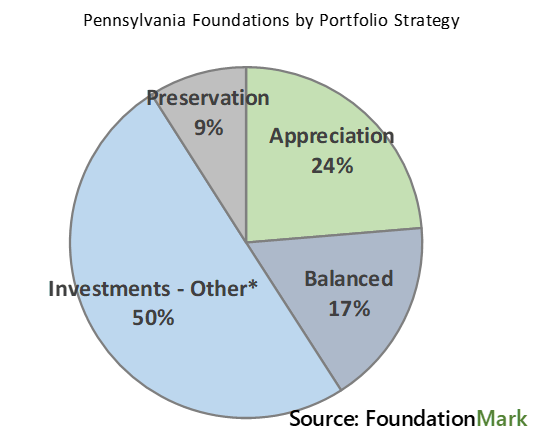
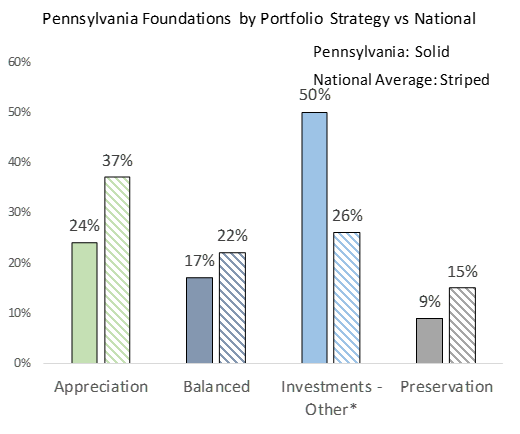
Pennsylvania Foundations by FoundationMark Portfolio Strategy
Pennsylvania’s strong median investment returns may be a function of a relatively small number, 9%, of foundations pursuing a Capital Preservation strategy, which had the weakest returns among the FoundationMark strategies for the period.
Pennsylvania Foundations’ Portfolio Strategies
24% of Pennsylvania foundations were categorized as Capital Appreciation by FoundationMark, 13% lower than the national average.
17% of Pennsylvania foundations had a Balanced strategy, 5% lower than the national average.
50% of Pennsylvania foundations were categorized as ‘Investments – Other’, 24% higher than the national average.
9% of Pennsylvania foundations had a Capital Preservation strategy, 6% lower than the national average.
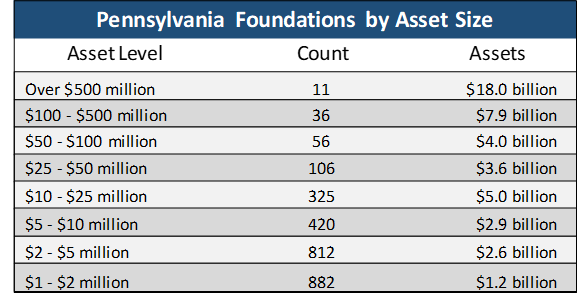
Foundations by Asset Level
The table “Pennsylvania Foundations by Asset Size” provides the distribution of Pennsylvania foundations by asset level.
Close to 2,600 Pennsylvania foundations have assets exceeding $1 million.
Pennsylvania has 5 of the 100 largest U.S. foundations according to asset size.
Over 200 Pennsylvania foundations have assets of over $25 million.
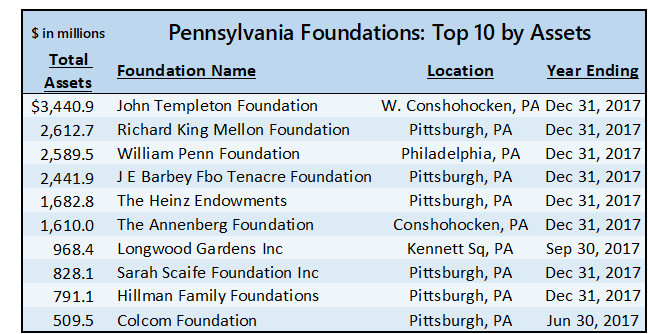
Top Ten Foundations by Assets
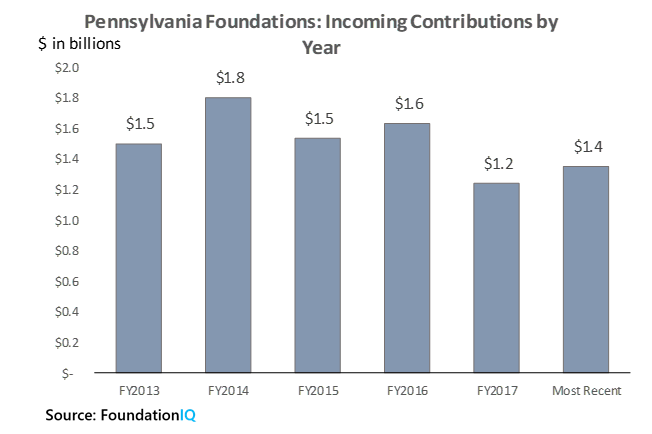
Incoming Contributions
Pennsylvania foundations received $1.4 billion in incoming contributions in the most recent year, and $7.9 billion cumulatively over the past 5 years, the eighth highest among all 50 states.
Foundations with Largest 3-yr Incoming Contributions
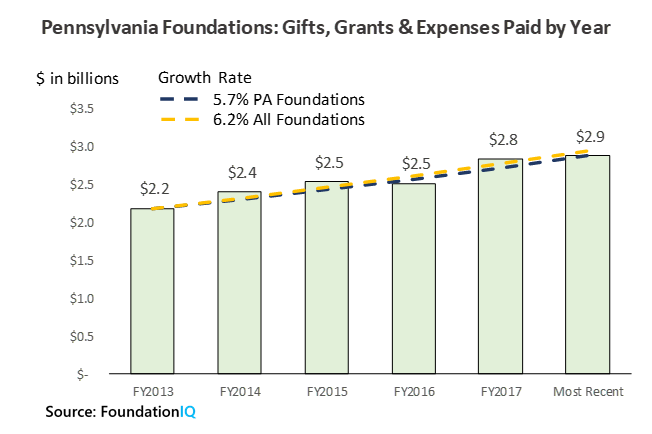
Grants, Gifts and Operating Expenses
The chart above shows that annual philanthropic support by Pennsylvania foundations increased by $700 million a year, from $2.2 billion per year in 2013 to $2.9 billion in the most recent year, an increase of over 30%.
Pennsylvania foundations paid $12.5 billion cumulatively over the past 5 years, the sixth largest among states in dollar terms.
Pennsylvania’s 5-year giving growth of 5.2% per year trailed the national average of 6.2% and ranked in the bottom half among all states over the period.
Major Grantmakers
If you would like to learn more about the over 2,600 foundations in Pennsylvania that we follow, or the other 40,000 foundations outside of Pennsylvania that we also track, including performance and expense data, please visit our affiliated companies: