Footer
Are you a trustee?
Interested in a free FoundationMark report on your foundation’s investment performance? click here
Contact Details
E-Mail: info@FoundationAdvocate.com
By
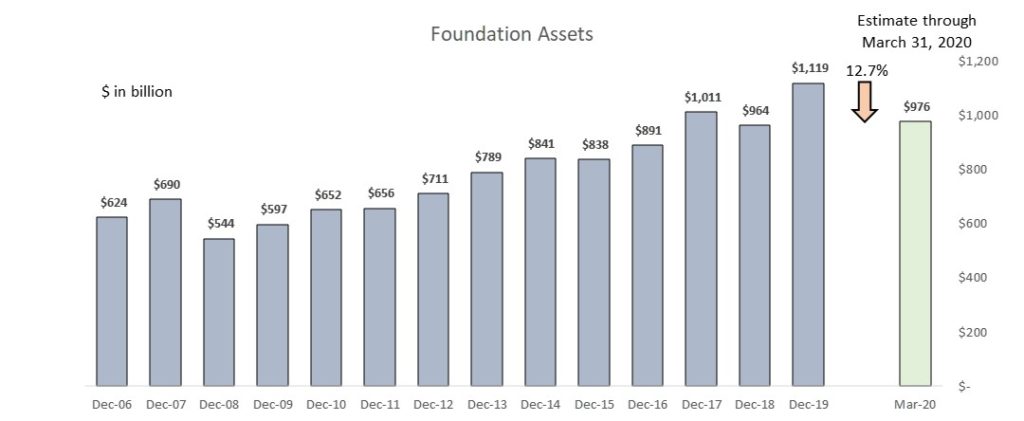
Preliminary March estimates from our affiliate, FoundationMark, indicate that foundation assets are down about 12.7% since the beginning of the year.
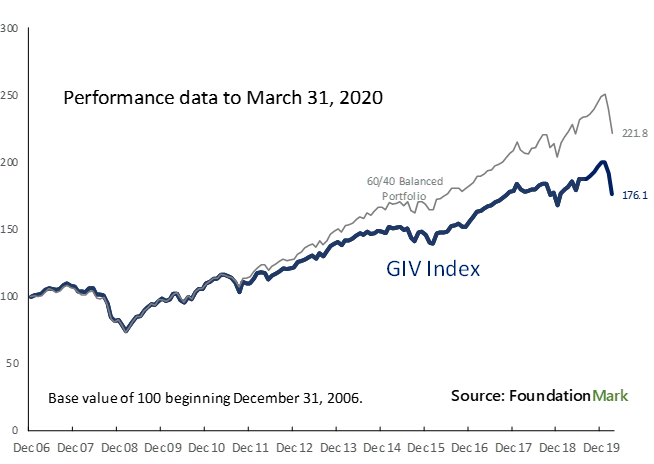
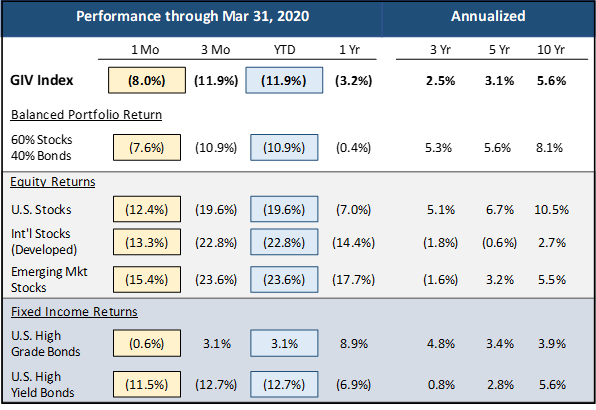
As seen in the chart and table above, the coronavirus pandemic has had a chilling impact on global equity markets, just one month after hitting all time highs, all major equity markets are down about 20-25%. The chart below shows that foundation assets (as estimated by FoundationMark), which started the year over $1.1 trillion have pulled back by about 12.7% to just over $975 billion. (Note: the GIV index reflects investment performance, while asset levels also account for projected cash flow).
First off, it is important to note that there is no way to forecast where markets will go, how foundations’ asset managers will react, or exactly how performance will translate into giving in overall terms or timing, so everything in this note should be viewed from a “ceteris paribus” perspective.
At the most basic level, foundation giving can be described using the formula:
Assets x Distribution Ratio* = Giving
*(Many people will assume that the distribution ratio is the mandated 5%, but as you will see below that hasn’t been the case.)
Therefor one might draw the conclusion that with about 13% lower, giving will also fall about 13%. If history is a guide, this is not likely to be the case. Overall foundations adjust their grantmaking on much more gradual basis.
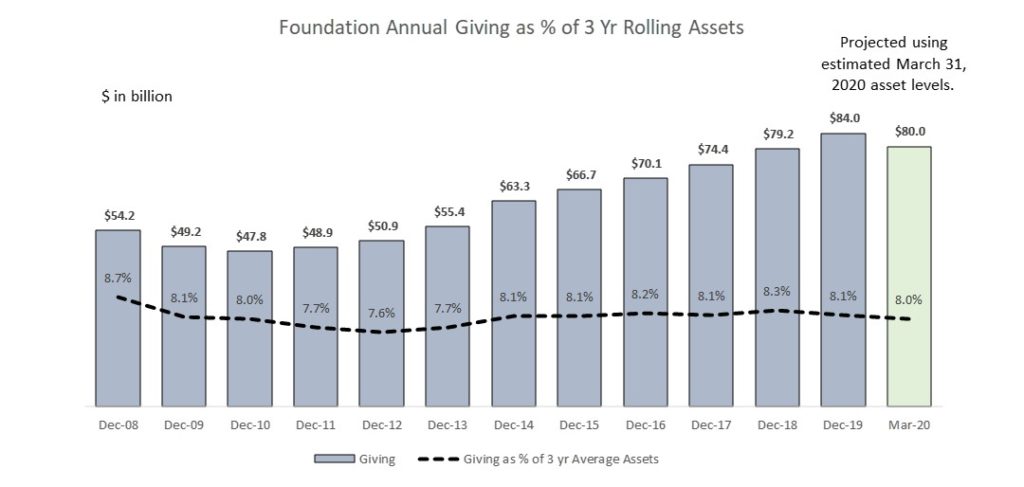
As seen in the chart below a more accurate formula describing the relationship between asset levels and payout ratios calls for an 8% payout ration of 3 year average assets:
3 Year Average Assets x 8% = Giving
Clearly, any forecast of philanthropic giving has to come with significant caveats, but we wanted to provide some base metrics to estimate giving. The purpose is to provide a “with what we know now” perspective for giving levels and we highlight the main assumptions used in forecasts.
If foundations’ investment performance is flat for the remainder of the year – so down about 12%. End of year asset will be about $925 billion. (Lower than current levels after accounting for cash flow), and 3 year average assets will be about $990 billion.
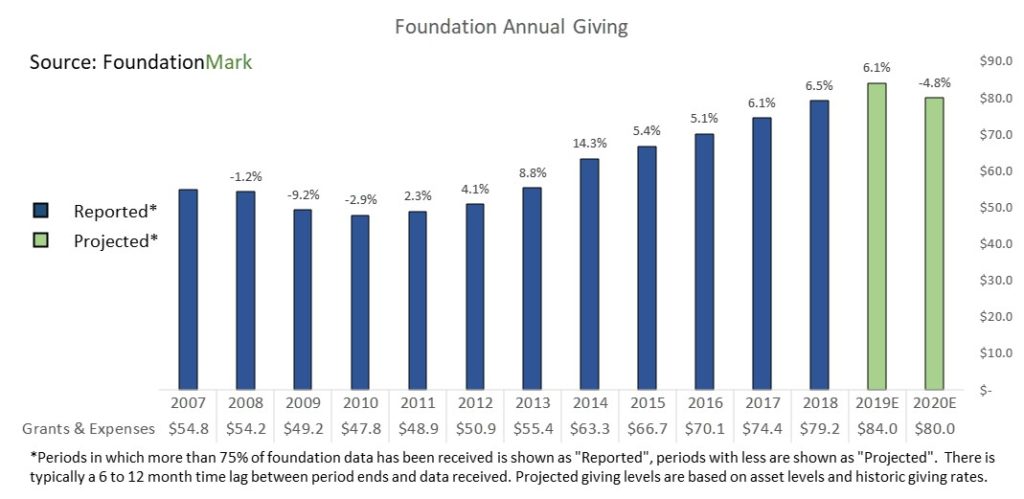
Using the formula above implies a giving level of $80.0 billion
3 Year Average Assets x Distribution = Giving
$990 billion x 8% = $80.0 billion
At $80.0 billion, foundation giving would be down 4.8% from 2019 estimates, and right around 2018 levels. (see bottom chart)
From a financial point of view, the current market conditions have been compared to the financial crisis of 2008. The chart below shows the giving pattern throughout the downturn when foundation assets fell over 20% in 2008, giving fell 9.2% in 2009, another 2.9% in 2010 before recovering.
The U.S, along with the rest of the world is in uncharted territory, so we don’t really know what’s next. What we can promise is that as events develop we will continue to track the financial performance of foundations and provide the nonprofit community with data and resources to help keep them informed now and in the future.
Interested in a free FoundationMark report on your foundation’s investment performance? click here
E-Mail: info@FoundationAdvocate.com