Footer
Are you a trustee?
Interested in a free FoundationMark report on your foundation’s investment performance? click here
Contact Details
E-Mail: info@FoundationAdvocate.com
By
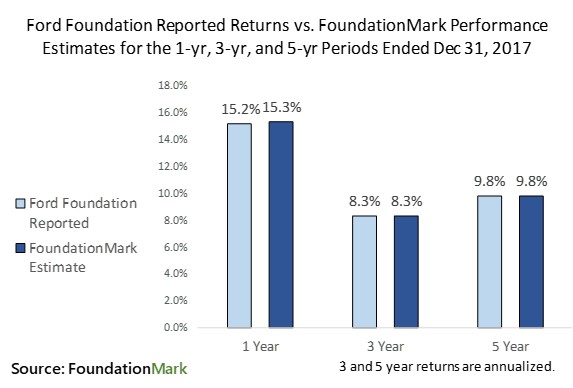
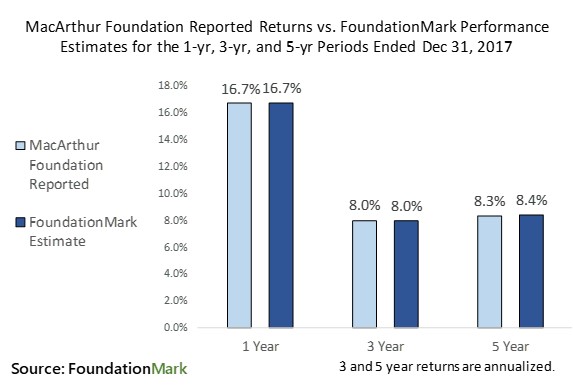
After learning that our affiliate, FoundationMark, estimates the investment performance of foundations, the first questions one might ask is how accurate are the estimates? Of course that raises a Catch-22 situation – if foundations reported their performance, you wouldn’t need estimates. Fortunately, several large foundations do report their investment performance, enabling comparisons of the FoundationMark estimates to the foundations’ published figures.
Below we compare FoundationMark’s estimates with all the published data we could find starting with the largest by asset value and working down from there. If you know of any other published data, please let us know and we will be sure to include it.
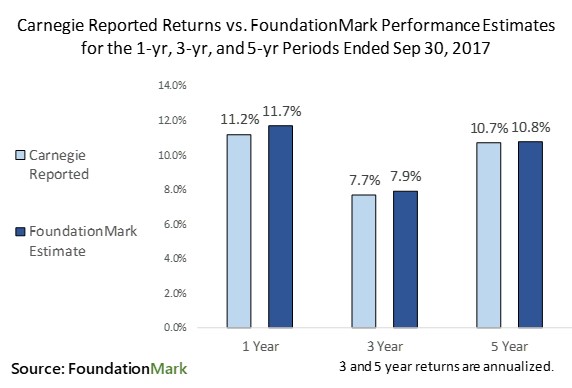
Important note: Foundations nay have different fiscal years from one another, for example Carnegie uses a September year-end, Commonwealth follows a June year, so the time periods in the charts may not be comparable from one foundation to another. Also, filings arrive on a rolling basis, so the years covered may also vary from one foundation to the next.
Ford Foundation Details
Assets: $13.8 billion as of December 31, 2017.
Location of investment performance information: click here.
Note: Data is on page 5 of linked document.
MacArthur Foundation Details
Assets: $7.0 billion as of December 31, 2017.
Location of investment performance information: click here.
Important Note: This is not Duke University, it is the James B. Duke Endowment.
Duke Endowment Details
Assets: $3.7 billion as of December 31, 2017.
Location of investment performance information: click here.
Note: Investment performance details are on page 36 of the annual report.
Carnegie Corporation Details
Assets: $3.5 billion as of November 30, 2017.
Location of investment performance information: click here.
Note: Investment performance details are on page 93 of the annual report.
Commonwealth Fund Details
Assets: $760 million as of June 30, 2018.
Location of investment performance information: click here.
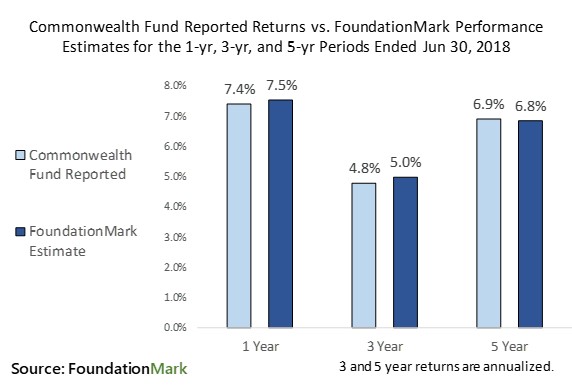
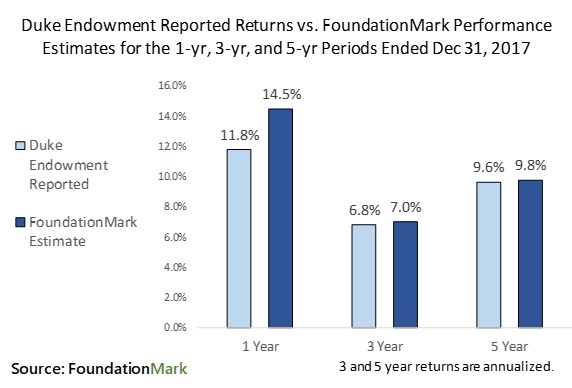
As you can see, the FoundationMark estimates are within 20 basis points of the reported numbers for all foundation for the 3-year and 5-year periods.
The only significant outlier is Duke’s 1-year number, which we believe is likely caused by a timing difference (we believe Duke uses September valuations for some assets like private equity, and December for the rest as there can be long time lag between period and and valuation reports for illiquid assets). Over a longer period, the effect of this type of timing difference is minimized.
It bears noting that the foundation that publish their returns are among the largest in the country and have more complex balance sheets and cash flows than the typical grant making foundation. Estimates for foundations with simpler assets and cash flows are likely to be even more accurate.
Interested in a free FoundationMark report on your foundation’s investment performance? click here
E-Mail: info@FoundationAdvocate.com