By
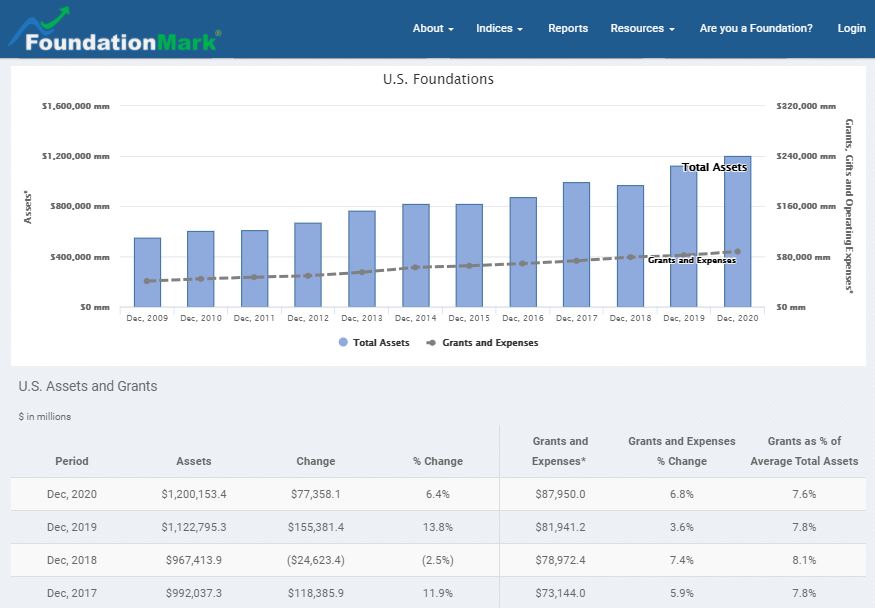
The graph and table below show current estimated foundation assets grew to $1.2 trillion at the end of 2020. The FoundationMark assumptions underlying the asset level are shown at right, including a giving level of $88 billion, up about 7% from 2019. We recognize that giving may have been higher as foundations may have responded to the pandemic by increasing payout rates.
Underlying Assumptions
*Investment performance is drawn from the FoundationMark GIV Index, Giving is total grants and operating expenses using an 8% of 3-year rolling asset levels payout rate, Incoming Contributions estimate is based on historic levels ($30 – $60 billion over last 10 years).

The 12 year bull market in U.S. stocks has fueled foundation asset growth and in turn philanthropic support.
It bears noting that in the past decade, giving has nearly doubled, from $47 billion a year in 2011 to an estimated $88 billion last year, an increase of about 6.5% per year, roughly in line with investment performance of an estimated 7.6% over the period.
The long term perspective emphasizes the fundamental relationship between giving and investment performance, or put more bluntly, the better a job foundations do managing their assets, the more money they can give to operating charities.
Interested in a free FoundationMark report on your foundation’s investment performance? click here
E-Mail: info@FoundationAdvocate.com