News and Analysis of Foundation Investment Performance
Fourth Quarter Investment Performance
By
Foundation Portfolios Up 1.6% in 4th Quarter
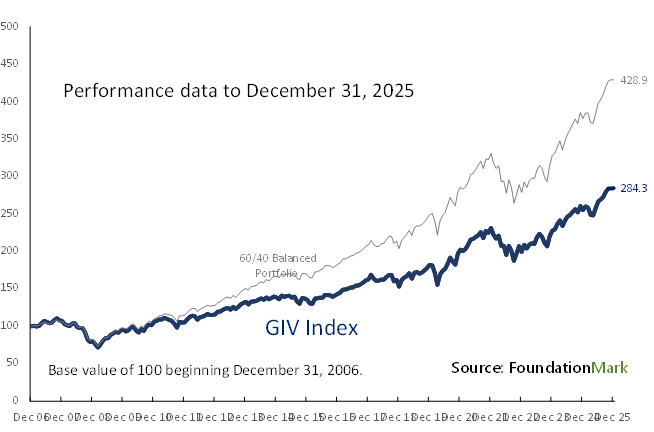
The Grantmaker Investment Value Index (“GIV”) rose 1.6% in the third quarter, bringing year-to-date gains to 11.4%. The GIV Index stood at a record high as of December 31, 2025 with 10-year returns annualized at 7.7%. However, foundations continue to lag the traditional institutional portfolio mix comprised of 60% in the S&P 500 and 40% in the Bloomberg Aggregate Index which posted annual gains of 9.8% for the decade ended December 2025.
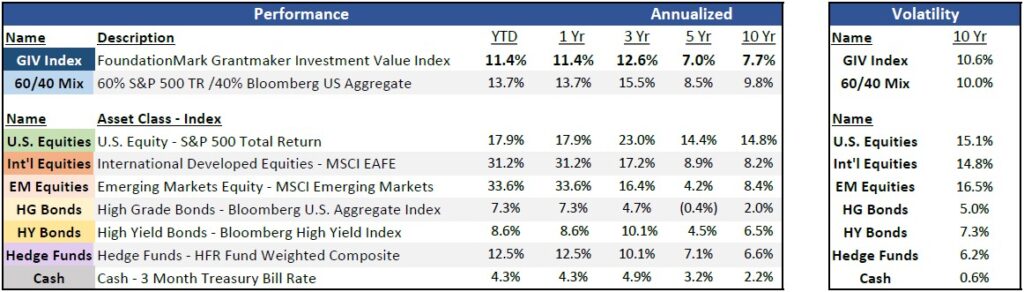
U.S. equity markets continued to post solid gains in the fourth quarter of 2025 with the S&P 500 up 2.7%, bringing year-to- date performance to 17.9%. International developed markets had another good quarter, up 4.9% bringing the year-to-date gain to a very impressive 31.2%. Emerging markets also posted large gains in the quarter, up 4.7%, bringing year-to-date performance to 33.6%.
Despite foreign markets outperforming the U.S. in 2025. over the long term, international and emerging markets have trailed the U.S. by a significant margin. Over the last decade, the S&P 500 has returned 14.8% annually compared to international and emerging markets, which were up 8.2% and 8.4% respectively.
U.S. high grade bonds were steady, gaining 1.1% for the quarter and 7.3% in 2025. High yield bonds returned 1.3% for the quarter and 8.6% for the year. Over the past ten years, high grade bonds have only returned 2.0% annually, less than cash at 2.2% per year.
Risk and Return
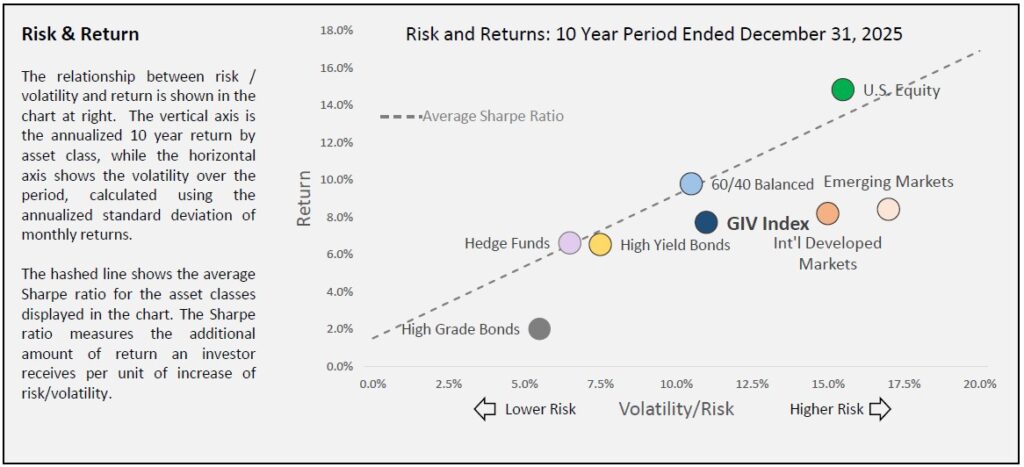
The chart below shows the relationship between risk and return. In the chart, risk is defined as volatility (shown on the x-axis) and return is plotted on the y-axis. Asset classes out to the right (International and Emerging Markets) are more volatile than those closer to the axis (High Grade Bonds). As one can see, over the 10-year period, U.S. Equities were the strongest performer, up 14.8% (y-axis). The dotted line shows an approximation of the average Sharpe ratio which is a measure of risk weighted return. Asset classes above the line delivered better risk/return than those below. U.S. Equity was the only significant outlier over the period (which also drove the 60/40), with Hedge Funds approaching the average line.
The GIV Index’s position, below and right of the 60/40 Portfolio indicates that foundations took more risk for less return than the passive 60/40 mix.
As one can see High Grade Bonds was the worst asset class by a long way and a poor asset allocation choice for the decade, with annualized returns of just 2.0%, investors would have been better off in cash. Foundations have returned about the same amount as international markets, but with lower risk.
Over the 10-year period to December 2025, U.S. Equities delivered nearly double the return of international stocks cumulatively with a similar risk profile.
The FoundationMark GIV Index is calculated using FoundationMark return estimates up to and including December 2024 thereafter monthly returns are estimated based on reported asset allocations and market returns. The GIV Index serves as a proxy for foundation performance. Actual performance may differ materially. The GIV Index is updated on a continuing basis and all data is subject to revision.
The 60/40 Balanced Portfolio represents the traditional institutional allocation to equities and fixed income with weightings of 60% in the S&P 500 and 40% in the Bloomberg U.S. Aggregate Index, rebalanced monthly.