Disbursements Projected to Increase 5.6% in 2025 Disbursement projections are a function of two variables; 1) asset level, and 2) payout ratio. Estimated March 2025 foundation assets were $1.554 trillion.Based on the two important caveats (see box) regarding asset levels and payout ratios that we highlight, we project foundation disbursements to rise 5.6% to $124.1 billion … [Read more...] about Disbursements Forecast Update: March 2025
First Quarter 2025 Assets Pull Back
FoundationMark models indicate that U.S. foundations' assets fell by $50 billion, or 3.2%, in the first quarter of 2025 resulting in assets dropping to $1.554 trillion. Foundation asset levels are a function of three variables: incoming contributions, outgoing grants and expenses, and investment performance. The Grantmaker Investment Value ("GIV") Index fell 2.1% in the first … [Read more...] about First Quarter 2025 Assets Pull Back
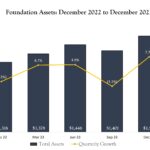
2024 Gains
FoundationMark models indicate that U.S. foundations' assets rose by nearly $170 billion, or about 11.5%, in 2024 pushing assets to $1.64 trillion. Foundation asset levels are a function of three variables: incoming contributions, outgoing grants and expenses, and investment performance. The Grantmaker Investment Value ("GIV") Index gained 13.4% year-to-date, correspondingly … [Read more...] about 2024 Gains
Disbursements Forecast Update: December 2024
Disbursements Projected to Increase 6.6% in 2024 Disbursement projections are a function of two variables; 1) asset level, and 2) payout ratio. Estimated September 2024 foundation assets reached a record $1.64 trillion, up $170 billion from 2023.Based on the two important caveats (see box) regarding asset levels and payout ratios that we highlight, we project foundation … [Read more...] about Disbursements Forecast Update: December 2024
Fourth Quarter Investment Performance
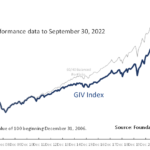
Foundation Portfolios Fell Modestly in the Fourth Quarter The Grantmaker Investment Value Index ("GIV") was essentially flat in the fourth quarter, bringing year-to-date performance to 13.4%. Foundation investment performance annualized at 6.9% per year for the ten years ended December 31, 2024, ahead of the required 5% payout ratio, though well below the 60/40 mix (the … [Read more...] about Fourth Quarter Investment Performance